Google 2013 Annual Report Download - page 37
Download and view the complete annual report
Please find page 37 of the 2013 Google annual report below. You can navigate through the pages in the report by either clicking on the pages listed below, or by using the keyword search tool below to find specific information within the annual report.-
 1
1 -
2
-
3
-
4
-
5
-
6
-
7
-
8
-
9
-
10
-
11
-
12
-
13
-
14
-
15
-
16
-
17
-
18
-
19
-
20
-
21
-
22
-
23
-
24
-
25
-
26
-
 27
27 -
 28
28 -
 29
29 -
 30
30 -
 31
31 -
 32
32 -
 33
33 -
 34
34 -
 35
35 -
 36
36 -
 37
37 -
 38
38 -
 39
39 -
 40
40 -
 41
41 -
 42
42 -
 43
43 -
 44
44 -
 45
45 -
 46
46 -
 47
47 -
48
-
49
-
50
-
51
-
52
-
53
-
54
-
55
-
56
-
57
-
58
-
59
-
60
-
61
-
62
-
63
-
64
-
65
-
66
-
67
-
68
-
69
-
70
-
71
-
72
-
73
-
74
-
75
-
76
-
77
-
78
-
79
-
80
-
81
-
82
-
83
-
84
-
85
-
86
-
87
-
88
-
89
-
90
-
91
-
92
-
93
-
94
-
95
-
96
 |
 |
31
PART II
ITEM7.Management’sDiscussionandAnalysisofFinancialConditionandResultsofOperations
Research and development expenses for the Motorola Mobile segment were not comparable between 2012 and 2013 because
approximatelysevenmonthsofresultswereincludedin2012whiletwelvemonthsofresultswereincludedin2013.Additionally,
we conducted various restructuring activities to simplify the Motorola Mobile product portfolio subsequent to the acquisition in
May2012.
Unallocateditems,includingstock-basedcompensationexpense,aswellasrestructuringandrelatedcharges,arenotallocated
toeachsegmentbecausewedonotincludethisinformationinourmeasurementoftheperformanceofouroperatingsegments.
We expect that research and development expenses will increase in dollar amount in 2014 and future periods because we expect
to continue to invest in building the necessary employee and system infrastructure required to support the development of new,
andtoimproveexisting,productsandservices.
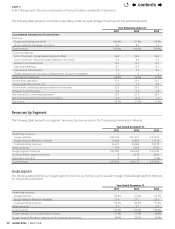
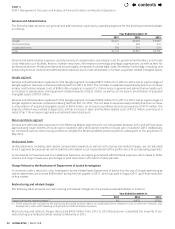
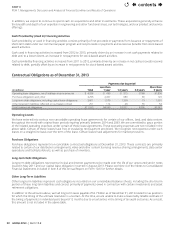
Sales and Marketing
The following table presents our sales and marketing expenses by operating segment for the periods presented (dollars in millions):
Year Ended December31,
2011 2012 2013
Google $4,228 $5,017 $6,002
Motorola Mobile 0 524 678
Elimination and unallocated items 361 602 573
Total $4,589 $6,143 $7,253
Sales and marketing expenses consist primarily of compensation and related costs for personnel engaged in customer service,
sales,andsalessupportfunctions,aswellasadvertisingandpromotionalexpenditures.
SalesandmarketingexpensesfortheGooglesegmentincreased$985millionfrom2012to2013andasapercentageofGoogle
segmentrevenuesremainedatfrom2012to2013.Theincreaseinexpenseswasprimarilyduetoanincreaseinadvertising
andpromotionalexpensesof$674million,aswellasanincreaseinlaborandfacilities-relatedcostsof$233million,largelyasa
resultofa13%increaseinsalesandmarketingheadcount.
Sales and marketing expenses for the Google segment increased $789 million from 2011 to 2012 and as a percentage of Google
segmentrevenuesremainedatfrom2011to2012.Theincreaseinexpenseswasprimarilyduetoanincreaseinlaborand
facilities-relatedcostsof$390million,largelyasaresultofa14%increaseinsalesandmarketingheadcount,aswellasanincrease
inadvertisingandpromotionalexpensesof$288million.
Sales and marketing expenses for the Motorola Mobile segment were not comparable between 2012 and 2013 because approximately
sevenmonthsofresultswereincludedin2012whiletwelvemonthsofresultswereincludedin2013.Additionally,weconducted
variousrestructuringactivitiestosimplifytheMotorolaMobileproductportfoliosubsequenttotheacquisitioninMay2012.
Eliminationitemsrepresentintersegmenttransactionsthatareeliminatedinconsolidation.Unallocateditems,includingstock-
based compensation expense, as well as restructuring and related charges, are not allocated to each segment because we do
notincludethisinformationinourmeasurementoftheperformanceofouroperatingsegments.
We expect that sales and marketing expenses will increase in dollar amount and may increase as a percentage of total revenues
in 2014 and future periods, as we expand our business globally, increase advertising and promotional expenditures in connection
with new and existing products, and increase the level of service we provide to our advertisers, Google Network Members, and
otherpartners.
contents