HP 2011 Annual Report Download - page 65
Download and view the complete annual report
Please find page 65 of the 2011 HP annual report below. You can navigate through the pages in the report by either clicking on the pages listed below, or by using the keyword search tool below to find specific information within the annual report.-
 1
1 -
2
-
3
-
4
-
5
-
6
-
7
-
8
-
9
-
10
-
11
-
12
-
13
-
14
-
15
-
16
-
17
-
18
-
19
-
20
-
21
-
22
-
23
-
24
-
25
-
26
-
27
-
28
-
29
-
30
-
31
-
32
-
33
-
34
-
35
-
36
-
37
-
38
-
39
-
40
-
41
-
42
-
43
-
44
-
45
-
46
-
47
-
48
-
49
-
50
-
51
-
52
-
53
-
54
-
 55
55 -
 56
56 -
 57
57 -
 58
58 -
 59
59 -
 60
60 -
 61
61 -
 62
62 -
 63
63 -
 64
64 -
 65
65 -
 66
66 -
 67
67 -
 68
68 -
 69
69 -
 70
70 -
 71
71 -
 72
72 -
 73
73 -
 74
74 -
 75
75 -
76
-
77
-
78
-
79
-
80
-
81
-
82
-
83
-
84
-
85
-
86
-
87
-
88
-
89
-
90
-
91
-
92
-
93
-
94
-
95
-
96
-
97
-
98
-
99
-
100
-
101
-
102
-
103
-
104
-
105
-
106
-
107
-
108
-
109
-
110
-
111
-
112
-
113
-
114
-
115
-
116
-
117
-
118
-
119
-
120
-
121
-
122
-
123
-
124
-
125
-
126
-
127
-
128
-
129
-
130
-
131
-
132
-
133
-
134
-
135
-
136
-
137
-
138
-
139
-
140
-
141
-
142
-
143
-
144
-
145
-
146
-
147
-
148
-
149
-
150
-
151
-
152
-
153
-
154
-
155
-
156
-
157
-
158
-
159
-
160
-
161
-
162
-
163
-
164
-
165
-
166
-
167
-
168
-
169
-
170
-
171
-
172
-
173
-
174
-
175
-
176
-
177
-
178
-
179
-
180
-
181
-
182
 |
 |

HEWLETT-PACKARD COMPANY AND SUBSIDIARIES
Management’s Discussion and Analysis of
Financial Condition and Results of Operations (Continued)
cost structure as a result of continued efforts to optimize our supply chain. The decrease in operating
expenses as a percentage of net revenue in fiscal 2011 was due primarily to reduced marketing and
administrative expenses, the effect of which was partially offset by higher field selling cost expenses.
IPG net revenue increased 7.3% (8.4% when adjusted for currency) in fiscal 2010, reflecting a
continued improvement in market conditions. Net revenue for Commercial Hardware increased 17% in
fiscal 2010, due primarily to unit volume growth of 19% driven by improved product availability.
Supplies net revenue increased 4% in fiscal 2010, due primarily to increased printing, which resulted in
stronger supply usage. Net revenue for Consumer Hardware increased 9% in fiscal 2010, driven
primarily by unit volume growth of 11%.
IPG earnings from operations as a percentage of net revenue decreased by 0.9 percentage points
in fiscal 2010, due primarily to a decline in gross margin and increases in operating expenses as a
percentage of net revenue. The gross margin decline in fiscal 2010 was due primarily to a higher mix of
Hardware and a correspondingly lower mix of Supplies, the effect of which was partially offset by cost
savings associated with our ongoing efforts to optimize our supply chain. The increase in operating
expenses as a percentage of net revenue in fiscal 2010 was due primarily to increased marketing
activities, the effect of which was partially offset by reduced administrative expenses.
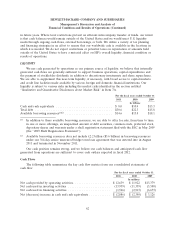
Enterprise Servers, Storage and Networking
For the fiscal years ended October 31
2011 2010 2009
In millions
Net revenue ........................................... $22,241 $20,356 $16,121
Earnings from operations ................................. $ 3,026 $ 2,825 $ 1,657
Earnings from operations as a % of net revenue ................ 13.6% 13.9% 10.3%
The components of the weighted net revenue change by ESSN business unit were as follows for
the following fiscal years ended October 31:
2011 2010
Percentage Points
Industry Standard Servers ............................................ 4.7 20.3
HP Networking .................................................... 4.3 5.9
Storage .......................................................... 1.3 1.9
Business Critical Systems (‘‘BCS’’) ...................................... (1.0) (1.8)
Total ESSN ....................................................... 9.3 26.3
ESSN net revenue increased 9.3% (7.3% when adjusted for currency) in fiscal 2011 due to growth
in HP Networking and ISS. Total revenue from server and storage blades increased by 10% in fiscal
2011. ISS net revenue increased by 8% in fiscal 2011, driven primarily by unit volume growth coupled
with increased average unit prices due to favorable demand for the latest generation of ISS products.
The revenue increase was also driven by expansion in our converged infrastructure solutions and strong
demand from public and private cloud customers. HP Networking net revenue increased by 51% due
largely to our acquisition of 3Com in April 2010, strong market demand for our core data center
products and the impact of our continued investments in sales coverage. Storage net revenue increased
by 7% in fiscal 2011 driven primarily by strong performance in products related to our acquisition of
3PAR in September 2010 and growth in scale out storage arrays, entry-level arrays and StoreOnce data
57