HP 2014 Annual Report Download - page 122
Download and view the complete annual report
Please find page 122 of the 2014 HP annual report below. You can navigate through the pages in the report by either clicking on the pages listed below, or by using the keyword search tool below to find specific information within the annual report.-
 1
1 -
2
-
3
-
4
-
5
-
6
-
7
-
8
-
9
-
10
-
11
-
12
-
13
-
14
-
15
-
16
-
17
-
18
-
19
-
20
-
21
-
22
-
23
-
24
-
25
-
26
-
27
-
28
-
29
-
30
-
31
-
32
-
33
-
34
-
35
-
36
-
37
-
38
-
39
-
40
-
41
-
42
-
43
-
44
-
45
-
46
-
47
-
48
-
49
-
50
-
51
-
52
-
53
-
54
-
55
-
56
-
57
-
58
-
59
-
60
-
61
-
62
-
63
-
64
-
65
-
66
-
67
-
68
-
69
-
70
-
71
-
72
-
73
-
74
-
75
-
76
-
77
-
78
-
79
-
80
-
81
-
82
-
83
-
84
-
85
-
86
-
87
-
88
-
89
-
90
-
91
-
92
-
93
-
94
-
95
-
96
-
97
-
98
-
99
-
100
-
101
-
102
-
103
-
104
-
105
-
106
-
107
-
108
-
109
-
110
-
111
-
 112
112 -
 113
113 -
 114
114 -
 115
115 -
 116
116 -
 117
117 -
 118
118 -
 119
119 -
 120
120 -
 121
121 -
 122
122 -
 123
123 -
 124
124 -
 125
125 -
 126
126 -
 127
127 -
 128
128 -
 129
129 -
 130
130 -
 131
131 -
 132
132 -
133
-
134
-
135
-
136
-
137
-
138
-
139
-
140
-
141
-
142
-
143
-
144
-
145
-
146
-
147
-
148
-
149
-
150
-
151
-
152
-
153
-
154
-
155
-
156
-
157
-
158
-
159
-
160
-
161
-
162
-
163
-
164
-
165
-
166
-
167
-
168
-
169
-
170
-
171
-
172
-
173
-
174
-
175
-
176
-
177
-
178
-
179
-
180
-
181
-
182
-
183
-
184
-
185
-
186
-
187
-
188
-
189
-
190
-
191
-
192
-
193
-
194
-
195
-
196
 |
 |

HEWLETT-PACKARD COMPANY AND SUBSIDIARIES
Notes to Consolidated Financial Statements (Continued)
Note 4: Retirement and Post-Retirement Benefit Plans (Continued)
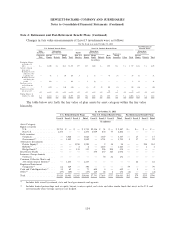
Changes in fair value measurements of Level 3 investments were as follows:
For the fiscal year ended October 31, 2014
Post-Retirement
U.S. Defined Benefit Plans Non-U.S. Defined Benefit Plans Benefit Plans
Debt Alternative Alternative Alternative
Securities Investments Equity Investments Investments
Insurance
Corporate Private Hedge Non U.S. Private Hedge Real Group Private
Debt Equity Hybrids Funds Total Equities Equity Funds Hybrids Estate Annuities Other Total Equity Hybrids Total
In millions
Beginning balance
at October 31,
2013 ....... $— $1,250 $ 2 $113 $1,365 $77 $48 $204 $— $325 $81 $ 2 $ 737 $234 $ 1 $235
Actual return on
plan assets:
Relating to assets
still held at the
reporting date . — 92 1 10 103 3 2 14 — 46 (8) — 57 51 — 51
Relating to assets
sold during the
period . . . . — 169 — — 169 — 2 (1) — — — — 1 21 — 21
Purchases, sales,
and settlements
(net) ...... 7 (227) — 140 (80) — (1) 68 43 108 (2) — 216 (35) — (35)
Transfers in and/or
out of Level 3 . . — — — — — — — — — 64 8 — 72 — — —
Ending balance at
October 31, 2014 $ 7 $1,284 $ 3 $263 $1,557 $80 $51 $285 $43 $543 $79 $ 2 $1,083 $271 $ 1 $272
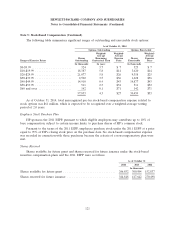
The table below sets forth the fair value of plan assets by asset category within the fair value
hierarchy.
As of October 31, 2013
U.S. Defined Benefit Plans Non-U.S. Defined Benefit Plans Post-Retirement Benefit Plans
Level 1 Level 2 Level 3 Total Level 1 Level 2 Level 3 Total Level 1 Level 2 Level 3 Total
In millions
Asset Category:
Equity securities
U.S. ................. $1,711 $ — $ — $ 1,711 $2,456 $ 31 $ — $ 2,487 $— $— $ — $ —
Non-U.S. .............. 1,274 — — 1,274 4,059 670 77 4,806 — — — —
Debt securities
Corporate .............. — 3,028 — 3,028 — 3,347 — 3,347 — 17 — 17
Government(1) ........... — 1,849 — 1,849 — 1,751 — 1,751 5 17 — 22
Alternative Investments
Private Equity(2) .......... — — 1,250 1,250 — 2 48 50 — — 234 234
Hybrids(3) .............. — — 2 2 — 1,223 — 1,223 — — 1 1
Hedge Funds(4) ........... — — 113 113 — 226 204 430 — — — —
Real Estate Funds .......... — — — — 470 237 325 1,032 — — — —
Insurance Group Annuity
Contracts .............. — — — — — 50 81 131 — — — —
Common Collective Trusts and
103-12 Investment Entities(5) . . . — 1,233 — 1,233 — — — — — 42 — 42
Registered Investment
Companies(6) ............ 61 329 — 390 — — — — 79 — — 79
Cash and Cash Equivalents(7) .... 11 62 — 73 648 4 — 652 — 3 — 3
Other(8) ................. (37) (20) — (57) 110 62 2 174 (2) — — (2)
Total ................... $3,020 $6,481 $1,365 $10,866 $7,743 $7,603 $737 $16,083 $82 $79 $235 $396
(1) Includes debt issued by national, state and local governments and agencies.
(2) Includes limited partnerships such as equity, buyout, venture capital, real estate and other similar funds that invest in the U.S. and
internationally where foreign currencies are hedged.
114