HP 2014 Annual Report Download - page 69
Download and view the complete annual report
Please find page 69 of the 2014 HP annual report below. You can navigate through the pages in the report by either clicking on the pages listed below, or by using the keyword search tool below to find specific information within the annual report.-
 1
1 -
2
-
3
-
4
-
5
-
6
-
7
-
8
-
9
-
10
-
11
-
12
-
13
-
14
-
15
-
16
-
17
-
18
-
19
-
20
-
21
-
22
-
23
-
24
-
25
-
26
-
27
-
28
-
29
-
30
-
31
-
32
-
33
-
34
-
35
-
36
-
37
-
38
-
39
-
40
-
41
-
42
-
43
-
44
-
45
-
46
-
47
-
48
-
49
-
50
-
51
-
52
-
53
-
54
-
55
-
56
-
57
-
58
-
 59
59 -
 60
60 -
 61
61 -
 62
62 -
 63
63 -
 64
64 -
 65
65 -
 66
66 -
 67
67 -
 68
68 -
 69
69 -
 70
70 -
 71
71 -
 72
72 -
 73
73 -
 74
74 -
 75
75 -
 76
76 -
 77
77 -
 78
78 -
 79
79 -
80
-
81
-
82
-
83
-
84
-
85
-
86
-
87
-
88
-
89
-
90
-
91
-
92
-
93
-
94
-
95
-
96
-
97
-
98
-
99
-
100
-
101
-
102
-
103
-
104
-
105
-
106
-
107
-
108
-
109
-
110
-
111
-
112
-
113
-
114
-
115
-
116
-
117
-
118
-
119
-
120
-
121
-
122
-
123
-
124
-
125
-
126
-
127
-
128
-
129
-
130
-
131
-
132
-
133
-
134
-
135
-
136
-
137
-
138
-
139
-
140
-
141
-
142
-
143
-
144
-
145
-
146
-
147
-
148
-
149
-
150
-
151
-
152
-
153
-
154
-
155
-
156
-
157
-
158
-
159
-
160
-
161
-
162
-
163
-
164
-
165
-
166
-
167
-
168
-
169
-
170
-
171
-
172
-
173
-
174
-
175
-
176
-
177
-
178
-
179
-
180
-
181
-
182
-
183
-
184
-
185
-
186
-
187
-
188
-
189
-
190
-
191
-
192
-
193
-
194
-
195
-
196
 |
 |

HEWLETT-PACKARD COMPANY AND SUBSIDIARIES
Management’s Discussion and Analysis of
Financial Condition and Results of Operations (Continued)
Fiscal 2014 compared with Fiscal 2013
Personal Systems net revenue increased 6.6% (increased 7.2% on a constant currency basis) in
fiscal 2014. While the Personal Systems business continues to be challenged by the market shift towards
mobility products, the pace of the PC market decline is slowing with signs of stabilization driven by
growth in commercial PCs, the effects of which were partially offset by weakness in consumer PCs. The
revenue increase in Personal Systems was due to growth in commercial PCs, particularly notebooks,
along with growth in consumer notebooks. Personal Systems experienced revenue growth across all
regions led by double digit revenue growth in EMEA, which experienced improved demand. The
revenue increase was driven by an 8.2% increase in unit volume, the effects of which were partially
offset by a 1.5% decline in average selling prices (‘‘ASPs’’). The unit volume increase was primarily led
by growth in commercial notebooks as well as strength in commercial desktops, consumer notebooks
and thin client products. The decline in ASPs was due primarily to a competitive pricing environment
and unfavorable currency impacts, the effects of which were partially offset by a favorable mix of
commercial PCs. Net revenue for commercial clients increased 10.2% due primarily to the benefits
from the delayed installed base refresh cycle, the effects of customers migrating from the Windows XP
operating system and growth in all product categories partly driven by new product introductions,
including the HP Elite products. Net revenue for consumer clients remained flat as growth in consumer
notebooks, partly driven by our new product lineup including Chromebooks and hybrid products, was
offset by a decline in consumer desktops. For fiscal 2014, net revenue for Notebook PCs increased 9%,
Desktop PCs increased 3%, Workstations increased 3% and Other net revenue increased 16%. The net
revenue increase in Other was due to the sale of IP and growth in mobility products, primarily
consumer tablets which were introduced in the second half of fiscal 2013.
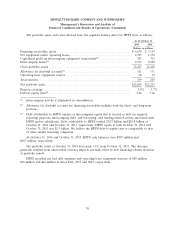
Personal Systems earnings from operations as a percentage of net revenue increased 0.7 percentage
points for fiscal 2014. The increase was driven by an increase in gross margin and a decline in
operating expenses as a percentage of net revenue. The increase in gross margin was due primarily to
operational cost improvements, a favorable commercial mix and the sale of IP, the effects of which
were partially offset by unfavorable currency impacts. Operating expenses as a percentage of net
revenue decreased due primarily to our cost structure optimization efforts, the effects of which were
partially offset by increased research and development investments for commercial, mobility and
immersive computing products, as well as higher administrative expenses driven by lower bad debt
recoveries as compared to fiscal 2013.
Fiscal 2013 compared with Fiscal 2012
Personal Systems net revenue decreased 10.2% (decreased 9.0% on a constant currency basis) in
fiscal 2013. The Personal Systems business continued to experience significant challenges due to the
overall PC market decline as a result of a customer shift, particularly consumers, to tablet products.
The business also experienced broad-based regional demand weakness, particularly in the EMEA
region. The decline in Personal Systems revenue was driven by an 8% decline in unit volume along
with a 3% decline in ASPs. The unit volume decrease was led by declines in consumer and notebook
products as a result of the market shift to tablet products. The decline in ASPs was due primarily to a
competitive pricing environment. Net revenue for consumer clients decreased 19%, while net revenue
for commercial clients decreased 4%. Notebook PCs net revenue decreased 15%, while Desktop PCs
net revenue decreased 8%. Workstations net revenue growth was flat, while Other net revenue
increased 19%. The net revenue increase in Other was related to increased sales of extended warranties
and third-party branded options and sales of consumer tablets.
61