HSBC 2004 Annual Report Download - page 5
Download and view the complete annual report
Please find page 5 of the 2004 HSBC annual report below. You can navigate through the pages in the report by either clicking on the pages listed below, or by using the keyword search tool below to find specific information within the annual report.-
 1
1 -
 2
2 -
 3
3 -
 4
4 -
 5
5 -
 6
6 -
 7
7 -
 8
8 -
 9
9 -
 10
10 -
 11
11 -
 12
12 -
 13
13 -
 14
14 -
 15
15 -
 16
16 -
17
-
18
-
19
-
20
-
21
-
22
-
23
-
24
-
25
-
26
-
27
-
28
-
29
-
30
-
31
-
32
-
33
-
34
-
35
-
36
-
37
-
38
-
39
-
40
-
41
-
42
-
43
-
44
-
45
-
46
-
47
-
48
-
49
-
50
-
51
-
52
-
53
-
54
-
55
-
56
-
57
-
58
-
59
-
60
-
61
-
62
-
63
-
64
-
65
-
66
-
67
-
68
-
69
-
70
-
71
-
72
-
73
-
74
-
75
-
76
-
77
-
78
-
79
-
80
-
81
-
82
-
83
-
84
-
85
-
86
-
87
-
88
-
89
-
90
-
91
-
92
-
93
-
94
-
95
-
96
-
97
-
98
-
99
-
100
-
101
-
102
-
103
-
104
-
105
-
106
-
107
-
108
-
109
-
110
-
111
-
112
-
113
-
114
-
115
-
116
-
117
-
118
-
119
-
120
-
121
-
122
-
123
-
124
-
125
-
126
-
127
-
128
-
129
-
130
-
131
-
132
-
133
-
134
-
135
-
136
-
137
-
138
-
139
-
140
-
141
-
142
-
143
-
144
-
145
-
146
-
147
-
148
-
149
-
150
-
151
-
152
-
153
-
154
-
155
-
156
-
157
-
158
-
159
-
160
-
161
-
162
-
163
-
164
-
165
-
166
-
167
-
168
-
169
-
170
-
171
-
172
-
173
-
174
-
175
-
176
-
177
-
178
-
179
-
180
-
181
-
182
-
183
-
184
-
185
-
186
-
187
-
188
-
189
-
190
-
191
-
192
-
193
-
194
-
195
-
196
-
197
-
198
-
199
-
200
-
201
-
202
-
203
-
204
-
205
-
206
-
207
-
208
-
209
-
210
-
211
-
212
-
213
-
214
-
215
-
216
-
217
-
218
-
219
-
220
-
221
-
222
-
223
-
224
-
225
-
226
-
227
-
228
-
229
-
230
-
231
-
232
-
233
-
234
-
235
-
236
-
237
-
238
-
239
-
240
-
241
-
242
-
243
-
244
-
245
-
246
-
247
-
248
-
249
-
250
-
251
-
252
-
253
-
254
-
255
-
256
-
257
-
258
-
259
-
260
-
261
-
262
-
263
-
264
-
265
-
266
-
267
-
268
-
269
-
270
-
271
-
272
-
273
-
274
-
275
-
276
-
277
-
278
-
279
-
280
-
281
-
282
-
283
-
284
-
285
-
286
-
287
-
288
-
289
-
290
-
291
-
292
-
293
-
294
-
295
-
296
-
297
-
298
-
299
-
300
-
301
-
302
-
303
-
304
-
305
-
306
-
307
-
308
-
309
-
310
-
311
-
312
-
313
-
314
-
315
-
316
-
317
-
318
-
319
-
320
-
321
-
322
-
323
-
324
-
325
-
326
-
327
-
328
-
329
-
330
-
331
-
332
-
333
-
334
-
335
-
336
-
337
-
338
-
339
-
340
-
341
-
342
-
343
-
344
-
345
-
346
-
347
-
348
-
349
-
350
-
351
-
352
-
353
-
354
-
355
-
356
-
357
-
358
-
359
-
360
-
361
-
362
-
363
-
364
-
365
-
366
-
367
-
368
-
369
-
370
-
371
-
372
-
373
-
374
-
375
-
376
-
377
-
378
 |
 |
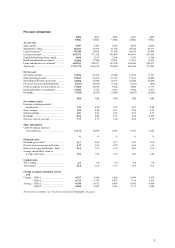
3
Five-year comparison
2004 2003 2002 2001 2000
US$m US$m US$m US$m US$m
At year-end
Share capital ............................................. 5,587 5,481 4,741 4,678 4,634
Shareholders’ funds .................................. 86,623 74,473 51,765 45,688 45,631
Capital resources12 ..................................... 90,780 74,042 57,430 50,854 50,964
Customer accounts .................................... 693,751 573,130 495,438 449,991 427,069
Undated subordinated loan capital ............ 3,686 3,617 3,540 3,479 3,546
Dated subordinated loan capital ................ 22,800 17,580 14,831 12,001 12,676
Loans and advances to customers13 .......... 669,831 528,977 352,344 308,649 289,837
Total assets ............................................... 1,276,778 1,034,216 758,605 695,545 673,503
For the year
Net interest income ................................... 31,024 25,598 15,460 14,725 13,723
Other operating income ............................ 19,563 15,474 11,135 11,163 10,850
Operating profit before provisions ............ 22,898 18,540 10,787 10,484 10,486
Provisions for bad and doubtful debts ...... (6,357) (6,093) (1,321) (2,037) (932)
Profit on ordinary activities before tax ...... 17,608 12,816 9,650 8,000 9,775
Profit attributable to shareholders ............. 11,840 8,774 6,239 4,992 6,457
Dividends .................................................. (7,301) (6,532) (5,001) (4,467) (4,010)
US$ US$US$US$US$
Per ordinary share
Earnings excluding goodwill
amortisation3 ......................................... 1.25 0.99 0.76 0.63 0.80
Basic earnings ........................................... 1.09 0.84 0.67 0.54 0.74
Diluted earnings ........................................ 1.07 0.83 0.66 0.53 0.73
Dividends .................................................. 0.66 0.60 0.53 0.48 0.435
Net asset value at year end ........................ 7.75 6.79 5.46 4.88 4.92
Share information
US$0.50 ordinary shares in
issue (millions) ...................................... 11,172 10,960 9,481 9,355 9,268
%%%%%
Financial ratios
Dividend payout ratio14 ............................. 52.7 60.6 69.7 76.2 54.4
Post-tax return on average total assets ...... 1.12 1.01 0.97 0.86 1.31
Return on average shareholders’ funds ..... 14.4 13.0 12.4 10.6 15.8
Average shareholders’ funds to
average total assets ............................... 7.02 7.06 6.91 6.87 6.64
Capital ratios
Tier 1 capital ............................................. 8.9 8.9 9.0 9.0 9.0
Total capital .............................................. 12.0 12.0 13.3 13.0 13.3
Foreign exchange translation rates to
US$
Closing – US$1:£ ..................................... 0.517 0.560 0.620 0.690 0.670
– US$1:€ ..................................... 0.733 0.793 0.953 1.130 1.076
Average – US$1:£ ..................................... 0.546 0.612 0.666 0.695 0.660
– US$1:€ ..................................... 0.805 0.885 1.061 1.117 1.084
For the above footnotes, see ‘Footnotes to Financial Highlights’ on page 4.