HSBC 2005 Annual Report Download - page 6
Download and view the complete annual report
Please find page 6 of the 2005 HSBC annual report below. You can navigate through the pages in the report by either clicking on the pages listed below, or by using the keyword search tool below to find specific information within the annual report.-
 1
1 -
 2
2 -
 3
3 -
 4
4 -
 5
5 -
 6
6 -
 7
7 -
 8
8 -
 9
9 -
 10
10 -
 11
11 -
 12
12 -
 13
13 -
 14
14 -
 15
15 -
 16
16 -
 17
17 -
18
-
19
-
20
-
21
-
22
-
23
-
24
-
25
-
26
-
27
-
28
-
29
-
30
-
31
-
32
-
33
-
34
-
35
-
36
-
37
-
38
-
39
-
40
-
41
-
42
-
43
-
44
-
45
-
46
-
47
-
48
-
49
-
50
-
51
-
52
-
53
-
54
-
55
-
56
-
57
-
58
-
59
-
60
-
61
-
62
-
63
-
64
-
65
-
66
-
67
-
68
-
69
-
70
-
71
-
72
-
73
-
74
-
75
-
76
-
77
-
78
-
79
-
80
-
81
-
82
-
83
-
84
-
85
-
86
-
87
-
88
-
89
-
90
-
91
-
92
-
93
-
94
-
95
-
96
-
97
-
98
-
99
-
100
-
101
-
102
-
103
-
104
-
105
-
106
-
107
-
108
-
109
-
110
-
111
-
112
-
113
-
114
-
115
-
116
-
117
-
118
-
119
-
120
-
121
-
122
-
123
-
124
-
125
-
126
-
127
-
128
-
129
-
130
-
131
-
132
-
133
-
134
-
135
-
136
-
137
-
138
-
139
-
140
-
141
-
142
-
143
-
144
-
145
-
146
-
147
-
148
-
149
-
150
-
151
-
152
-
153
-
154
-
155
-
156
-
157
-
158
-
159
-
160
-
161
-
162
-
163
-
164
-
165
-
166
-
167
-
168
-
169
-
170
-
171
-
172
-
173
-
174
-
175
-
176
-
177
-
178
-
179
-
180
-
181
-
182
-
183
-
184
-
185
-
186
-
187
-
188
-
189
-
190
-
191
-
192
-
193
-
194
-
195
-
196
-
197
-
198
-
199
-
200
-
201
-
202
-
203
-
204
-
205
-
206
-
207
-
208
-
209
-
210
-
211
-
212
-
213
-
214
-
215
-
216
-
217
-
218
-
219
-
220
-
221
-
222
-
223
-
224
-
225
-
226
-
227
-
228
-
229
-
230
-
231
-
232
-
233
-
234
-
235
-
236
-
237
-
238
-
239
-
240
-
241
-
242
-
243
-
244
-
245
-
246
-
247
-
248
-
249
-
250
-
251
-
252
-
253
-
254
-
255
-
256
-
257
-
258
-
259
-
260
-
261
-
262
-
263
-
264
-
265
-
266
-
267
-
268
-
269
-
270
-
271
-
272
-
273
-
274
-
275
-
276
-
277
-
278
-
279
-
280
-
281
-
282
-
283
-
284
-
285
-
286
-
287
-
288
-
289
-
290
-
291
-
292
-
293
-
294
-
295
-
296
-
297
-
298
-
299
-
300
-
301
-
302
-
303
-
304
-
305
-
306
-
307
-
308
-
309
-
310
-
311
-
312
-
313
-
314
-
315
-
316
-
317
-
318
-
319
-
320
-
321
-
322
-
323
-
324
-
325
-
326
-
327
-
328
-
329
-
330
-
331
-
332
-
333
-
334
-
335
-
336
-
337
-
338
-
339
-
340
-
341
-
342
-
343
-
344
-
345
-
346
-
347
-
348
-
349
-
350
-
351
-
352
-
353
-
354
-
355
-
356
-
357
-
358
-
359
-
360
-
361
-
362
-
363
-
364
-
365
-
366
-
367
-
368
-
369
-
370
-
371
-
372
-
373
-
374
-
375
-
376
-
377
-
378
-
379
-
380
-
381
-
382
-
383
-
384
-
385
-
386
-
387
-
388
-
389
-
390
-
391
-
392
-
393
-
394
-
395
-
396
-
397
-
398
-
399
-
400
-
401
-
402
-
403
-
404
-
405
-
406
-
407
-
408
-
409
-
410
-
411
-
412
-
413
-
414
-
415
-
416
-
417
-
418
-
419
-
420
-
421
-
422
-
423
-
424
 |
 |

HSBC HOLDINGS PLC
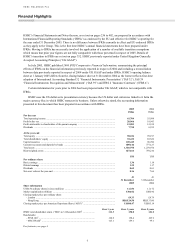
Financial Highlights (continued)
4
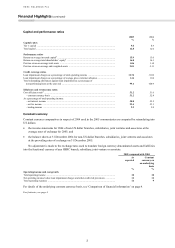
Five-year comparison (continued)
Amounts in accordance with US GAAP
2005 2004 2003 2002 2001
US$m US$m US$m US$m US$m
Income statement for the year
Net income available for ordinary
shareholders ........................................ 14,703 12,506 7,231 4,900 4,911
Other comprehensive income .................. (7,271) 983 7,401 5,502 (1,439)
Dividends ................................................ 7,750 6,932 6,974 4,632 4,394
Balance sheet at 31 December
Total assets .............................................. 1,406,944 1,266,365 1,012,023 763,565 698,312
Shareholders’ funds ................................. 93,524 90,082 80,251 55,831 48,444
US$ US$US$US$US$
Per ordinary share
Basic earnings ......................................... 1.33 1.15 0.69 0.52 0.53
Diluted earnings ...................................... 1.32 1.13 0.69 0.52 0.53
Dividends ................................................ 0.69 0.63 0.685 0.495 0.48
Net asset value at year end ...................... 8.25 8.06 7.32 5.89 5.18
Comparison of financial information
When reference to ‘constant currency’ or ‘constant exchange rates’ is made, comparative data reported in the
functional currencies of HSBC’s operations have been translated at the appropriate exchange rates applied in the
current period in respect of the income statement or the balance sheet. When reference to ‘underlying basis’ is made,
comparative information has been expressed at constant currency and adjusted for the effect of acquisitions and the
change in presentation of non-equity minority issues.
As the transition to IFRSs affects the comparability of the financial information presented in this document (see
Note 1 on the Financial Statements), the commentary that follows specifies the impact when this is material to a
reader’s understanding of the underlying business trends.
Footnotes to ‘Financial Highlights’
1 Each ADS represents five ordinary shares.
2 Total shareholder return (‘TSR’) is defined on page 220.
3 The Financial Times-Stock Exchange 100 Index.
4 The Morgan Stanley Capital International World Index.
5 The definition of return on average invested capital and a reconciliation to the equivalent GAAP measures are set out on page 43.
6 The return on average total shareholders’ equity is defined as profit attributable to shareholders of the parent company divided by
average total shareholders’ equity.
7 The cost efficiency ratio is defined as total operating expenses divided by net operating income before loan impairment charges and
other credit risk provisions.
8 Comparative data for 2004 excludes the provisions of IAS 32, IAS 39 and IFRS 4, which were adopted for the first time with effect
from 1 January 2005.
9 The periods 2001-2003 were prepared in accordance with UK GAAP. The principal adjustments necessary to conform these periods
with IFRSs are described in Note 46 on the Financial Statements on page 332. HSBC’s accounting policies under UK GAAP are
stated in Note 2 on the Financial Statements in the 2004 Annual Report and Accounts.
10 Capital resources are defined on page 173. A detailed computation for 2005 and 2004 is provided on page 176.
11 Net of suspended interest and provisions for bad and doubtful debts (UKGAAP).
12 Net of impairment allowances against customers (IFRSs).
13 Dividends per share expressed as a percentage of earnings per share (2001 to 2003: excluding goodwill amortisation).