Kohl's 1998 Annual Report Download - page 2
Download and view the complete annual report
Please find page 2 of the 1998 Kohl's annual report below. You can navigate through the pages in the report by either clicking on the pages listed below, or by using the keyword search tool below to find specific information within the annual report.-
 1
1 -
 2
2 -
 3
3 -
 4
4 -
 5
5 -
 6
6 -
 7
7 -
 8
8
 |
 |

Another great year for
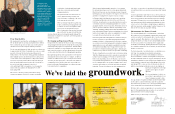
We’ve Laid the Groundwork 2-3
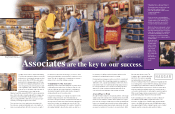
Associates are the Key to
Our Success 4-5
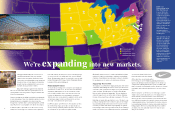
We’re Expanding into
New Markets 6-7
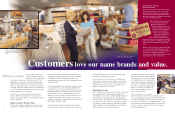
Customers Like Our
Name Brands and Value 8-9
Financial and Operating Data 10-11
Corporate Information 12
Contents
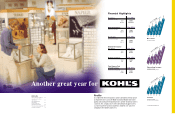
Trifari, Napier and 1928
are just a few of the jew-
elry brand names cus-
tomers find at Kohl’s.
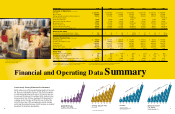
Net Sales
Up 20%
(In millions of dollars)
1997
1998
$3,060.1
$3,681.8
Operating Income
Up 31%
(In millions of dollars)
1997
1998
$258.8
$337.9
Net Income
Up 36%
(In millions of dollars)
1997
1998
$141.3
$192.3
Diluted Net Income
Per Share
Up 30%
1997
1998
$0.91
$1.18
Number of Stores
Up 17%
1997
1998
182
213
Total Square Feet
of Selling Space
Up 21%
(At year end in thousands)
1997
1998
12,533
15,111
Financial Highlights
$1,554
94
95
96
97
98
$1,926
$2,388
$3,060
$3,682
Net Sales
(In millions of dollars)
24.1% CAGR*
$124
$150
$189
$259
$338
94
95
96
97
98
Operating Income
(In millions of dollars)
Excludes non-recurring charges.
28.5% CAGR*
$69
$81
$102
$141
$192
94
95
96
97
98
29.2% CAGR*
Income
(In millions of dollars)
Excludes non-recurring charges.
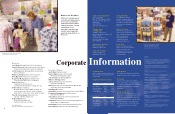
Profile
As of April 1999, Kohl’s Corporation operates 226 family-oriented, special-
ty department stores across the Midwest and mid-Atlantic that feature
quality, national brand merchandise priced to provide exceptional value to
customers. The company’s stores sell moderately-priced apparel, shoes,
accessories and home products targeted to middle income customers
shopping for their families and homes.
* Compounded annual growth rate