Kohl's 1998 Annual Report Download - page 7
Download and view the complete annual report
Please find page 7 of the 1998 Kohl's annual report below. You can navigate through the pages in the report by either clicking on the pages listed below, or by using the keyword search tool below to find specific information within the annual report.-
 1
1 -
 2
2 -
 3
3 -
 4
4 -
 5
5 -
 6
6 -
 7
7 -
 8
8
 |
 |

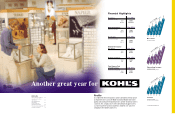
Our growth in women’s dresses reflects
our target customer increasingly shop-
ping for herself and her family.
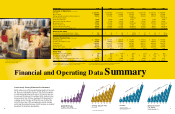
Consistently Strong Financial Performance
Kohl’s ranks as one of the top performing retailers in the coun-
try. Since our initial public offering in 1992, Kohl’s has grown
at compounded annual growth rates of 22.4 percent per year
for sales and 30.4 percent for earnings. Kohl’s stock price has
increased more than 19 times, making a $100 investment in
company stock at the time of IPO worth over $1,900 at the
end of the fiscal year. With our aggressive growth strategy
and strong financial performance, Kohl’s has been an excellent
investment for long-term shareholders.
Fiscal Year 1998 1997 1996 1995 1994 1993 1992
Summary of Operations
(In thousands)
Net sales $ 3,681,763 $ 3,060,065 $ 2,388,221 $ 1,925,669 $ 1,554,100 $1,305,746 $ 1,096,856
Gross margin 1,234,462 1,013,597 779,533 631,016 516,360 436,510 374,246
Selling, general and administrative expenses 810,162 678,793 536,226 436,442 356,893 305,547 269,158
Non-recurring charges -- - 14,052 (b) - - 17,735
Preopening expenses 16,388 18,589 10,302 10,712 8,190 5,360 2,992
Depreciation and amortization 70,049 57,380 44,015 33,931 27,402 23,201 19,834
Operating income 337,863 258,835 188,990 135,879 (b) 123,875 102,402 64,527
Interest expense, net 21,114 23,772 17,622 13,150 6,424 5,711 14,393
Income before income taxes 316,749 235,063 171,368 122,729 (b) 117,451 96,691 50,134
Net Income before extraordinary items 192,266 141,273 102,478 72,652 (b) 68,512 55,662 28,692
Earnings Per Share
Income before extraordinary items – basic $ 1.22 $ .93 $ .69 $ .49 (b) $ .47 $ .38 $ .22
Income before extraordinary items – diluted 1.18 .91 .68 .49 (b) .46 .38 .22
Financial Position Data
(In thousands)
Working capital $ 559,207 $ 525,251 $ 229,339 $ 175,368 $ 114,637 $ 86,856 $ 105,564
Property and equipment, net 933,011 749,649 596,227 409,168 298,737 186,626 141,196
Total assets 1,936,095 1,619,721 1,122,483 805,385 658,717 469,289 444,797
Long-term debt 310,912 310,366 312,031 187,699 108,777 51,852 95,096
Shareholders’ equity 1,162,779 954,782 517,471 410,638 334,249 262,502 207,400
Return on average shareholders’ equity 18.2 % 19.2 % 22.1 % 21.7 % 23.0 % 23.7 % N/A
Other Data
Comparable store sales growth 7.9 % 10.0 % 11.3 % 5.9 % 6.1 % 8.3 % 10.5
Net sales per selling square foot $ 265 $ 267 $ 261 $ 257 $ 258 $ 255 $ 239
Stores open at year end 213 182 150 128 108 90 79
Total square feet of selling space at year end (In thousands) 15,111 12,533 10,064 8,378 6,824 5,523 4,771
Capital expenditures, including capitalized leases (In thousands) $ 248,878 $ 202,735 $ 223,423 $ 138,797 $ 132,800 $ 64,813 $ 46,337
Financial and Operating D ata Summary
(a)
(a)
(a)
(a)
(a)
(a)
%
(a) The year ended J anuary 30, 1993, includes a non-recurring incentive compensa-
tion charge of $17.7 million ($10.6 million after-tax) or $.08 per share. (b) The year ended February 3, 1996, includes a non-recurring credit operations
charge of $14.1 million ($8.3 million after-tax) or $.06 per share.
1110
$10.97
$14.34
$19.44
$34.69
$67.75
94
$11.88
93
$8.69
92
95
96
97
98
Stock Price at
Fiscal Year End
(Adjusted for stock splits in 1996 and 1998)
6,824
8,378
10,064
12,533
15,111
94
5,523
93
4,771
92
95
96
97
98
Selling Square Feet
(In thousands)
21.2% CAGR*
$.46
$.55
$.68
$.91
$1.18
94
$.38
93
$.30
92
95
96
97
98
Diluted Income
Per Share
Excludes non-recurring charges
and extraordinary items.
25.6% CAGR*
* Compounded annual growth rate
$69
$81
$102
$141
$192
94
$56
93
$39
92
95
96
97
98
30.4% CAGR*
Income
(In millions of dollars)
Excludes non-recurring charges
and extraordinary items.