Kohl's 2015 Annual Report Download - page 57
Download and view the complete annual report
Please find page 57 of the 2015 Kohl's annual report below. You can navigate through the pages in the report by either clicking on the pages listed below, or by using the keyword search tool below to find specific information within the annual report.-
 1
1 -
2
-
3
-
4
-
5
-
6
-
7
-
8
-
9
-
10
-
11
-
12
-
13
-
14
-
15
-
16
-
17
-
18
-
19
-
20
-
21
-
22
-
23
-
24
-
25
-
26
-
27
-
28
-
29
-
30
-
31
-
32
-
33
-
34
-
35
-
36
-
37
-
38
-
39
-
40
-
41
-
42
-
43
-
44
-
45
-
46
-
 47
47 -
 48
48 -
 49
49 -
 50
50 -
 51
51 -
 52
52 -
 53
53 -
 54
54 -
 55
55 -
 56
56 -
 57
57 -
 58
58 -
 59
59 -
 60
60 -
 61
61 -
 62
62 -
 63
63 -
 64
64 -
 65
65 -
 66
66 -
 67
67 -
68
-
69
-
70
-
71
-
72
-
73
-
74
-
75
-
76
-
77
-
78
-
79
-
80
 |
 |

Table of Contents
All stock options have an exercise price equal to the fair market value of the common stock on the date of grant. The fair value of each option award
was estimated using a Black-Scholes option valuation model. The weighted average fair value of options granted in 2014 was $12.23 and in 2013 was
$10.68.
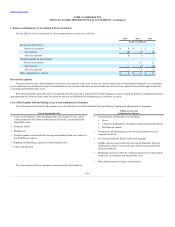
The following table summarizes our stock option activity:
Balance at beginning of year
11,375
$ 56.05
15,212
$ 53.96
Granted
186
54.69
575
47.86
Exercised
(2,647)
46.87
(2,494)
41.02
Forfeited/expired
(2,703)
72.21
(1,918)
56.59
Balance at end of year
6,211
$ 52.95
11,375
$ 56.05
The intrinsic value of options exercised represents the excess of our stock price at the time the option was exercised over the exercise price and was $52
million in 2015 and $30 million in both 2014 and 2013.
Additional information related to stock options outstanding and exercisable at January 30, 2016, segregated by exercise price range, is summarized
below:
$ 36.13 – $ 46.00 272
1.7
$ 42.75
219
1.2
$ 42.30
$ 46.01 – $ 49.00 759
3.4
47.76
385
3.6
47.84
$ 49.01 – $ 51.00 439
2.6
50.07
339
2.3
50.08
$ 51.01 – $ 55.00 749
2.8
52.73
447
2.3
52.87
$ 55.01 – $ 65.00 525
2.0
57.32
454
1.6
57.46
$ 65.01 – $ 77.62 332
1.0
67.75
332
1.0
67.75
3,076
2.5
$ 52.65
2,176
2.1
$ 53.71
Intrinsic value (in thousands) $ 3,450
$ 2,393
The intrinsic value of outstanding and exercisable stock options represents the excess of our closing stock price on January 30, 2016 ($49.75) over the
exercise price multiplied by the applicable number of stock options.
Nonvested stock awards
We have also awarded shares of nonvested common stock to eligible key employees and to our Board of Directors. Substantially all awards have
restriction periods tied primarily to employment and/or service. Employee awards generally vest over five years. Director awards vest over the term to which
the director was elected, generally one year. In lieu of cash dividends, nonvested stock awards are granted restricted stock equivalents which vest consistently
with the underlying nonvested stock awards.
The fair value of nonvested stock awards is the closing price of our common stock on the date of grant. We may acquire shares from employees in lieu
of amounts required to satisfy minimum tax withholding requirements upon the vesting of the employee’s unvested stock award. Such shares are then
designated as treasury shares.
F-18