Medtronic 2016 Annual Report Download - page 102
Download and view the complete annual report
Please find page 102 of the 2016 Medtronic annual report below. You can navigate through the pages in the report by either clicking on the pages listed below, or by using the keyword search tool below to find specific information within the annual report.-
 1
1 -
2
-
3
-
4
-
5
-
6
-
7
-
8
-
9
-
10
-
11
-
12
-
13
-
14
-
15
-
16
-
17
-
18
-
19
-
20
-
21
-
22
-
23
-
24
-
25
-
26
-
27
-
28
-
29
-
30
-
31
-
32
-
33
-
34
-
35
-
36
-
37
-
38
-
39
-
40
-
41
-
42
-
43
-
44
-
45
-
46
-
47
-
48
-
49
-
50
-
51
-
52
-
53
-
54
-
55
-
56
-
57
-
58
-
59
-
60
-
61
-
62
-
63
-
64
-
65
-
66
-
67
-
68
-
69
-
70
-
71
-
72
-
73
-
74
-
75
-
76
-
77
-
78
-
79
-
80
-
81
-
82
-
83
-
84
-
85
-
86
-
87
-
88
-
89
-
90
-
91
-
 92
92 -
 93
93 -
 94
94 -
 95
95 -
 96
96 -
 97
97 -
 98
98 -
 99
99 -
 100
100 -
 101
101 -
 102
102 -
 103
103 -
 104
104 -
 105
105 -
 106
106 -
 107
107 -
 108
108 -
 109
109 -
 110
110 -
 111
111 -
 112
112 -
113
-
114
-
115
-
116
-
117
-
118
-
119
-
120
-
121
-
122
-
123
-
124
-
125
-
126
-
127
-
128
-
129
-
130
-
131
-
132
-
133
-
134
-
135
-
136
-
137
-
138
-
139
-
140
-
141
-
142
-
143
-
144
-
145
-
146
-
147
-
148
-
149
-
150
-
151
-
152
-
153
-
154
-
155
-
156
-
157
-
158
 |
 |

Table of Contents
Medtronic plc
Notes to Consolidated Financial Statements (Continued)
99
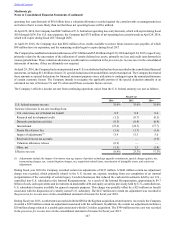
Balance Sheet Presentation
The following tables summarize the location and fair value amounts of derivative instruments reported in the consolidated balance
sheets as of April 29, 2016 and April 24, 2015. The fair value amounts are presented on a gross basis and are segregated between
derivatives that are designated and qualify as hedging instruments and those that are not, and are further segregated by type of
contract within those two categories.
April 29, 2016
Asset Derivatives Liability Derivatives
(in millions) Balance Sheet Location Fair
Value Balance Sheet Location Fair
Value
Derivatives designated as hedging
instruments
Interest rate contracts Prepaid expenses and other
current assets $ — Other accrued expenses $ —
Currency exchange rate contracts Prepaid expenses and other
current assets 123 Other accrued expenses 89
Interest rate contracts Other assets 89 Other long-term liabilities 48
Currency exchange rate contracts Other assets 9 Other long-term liabilities 54
Total derivatives designated as hedging
instruments $ 221 $ 191
Derivatives not designated as hedging
instruments
Commodity derivatives Prepaid expenses and other
current assets $ — Other accrued expenses $ 1
Currency exchange rate contracts Prepaid expenses and other
current assets 13 Other accrued expenses 23
Cross currency interest rate contracts Other assets 14 Other long-term liabilities 4
Total derivatives not designated as
hedging instruments $ 27 $ 28
Total derivatives $ 248 $ 219
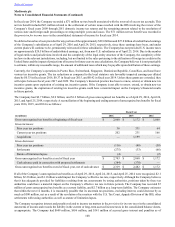
April 24, 2015
Asset Derivatives Liability Derivatives
(in millions) Balance Sheet Location Fair
Value Balance Sheet Location Fair
Value
Derivatives designated as hedging
instruments
Interest rate contracts Prepaid expenses and other
current assets $ 10 Other accrued expenses $ —
Currency exchange rate contracts Prepaid expenses and other
current assets 382 Other accrued expenses 12
Interest rate contracts Other assets 79 Other long-term liabilities 71
Currency exchange rate contracts Other assets 143 Other long-term liabilities 3
Total derivatives designated as hedging
instruments $ 614 $ 86
Derivatives not designated as hedging
instruments
Currency exchange rate contracts Prepaid expenses and other
current assets $ 119 Other accrued expenses $ 30
Total derivatives not designated as
hedging instruments $ 119 $ 30
Total derivatives $ 733 $ 116