Microsoft 2010 Annual Report Download - page 26
Download and view the complete annual report
Please find page 26 of the 2010 Microsoft annual report below. You can navigate through the pages in the report by either clicking on the pages listed below, or by using the keyword search tool below to find specific information within the annual report.-
 1
1 -
2
-
3
-
4
-
5
-
6
-
7
-
8
-
9
-
10
-
11
-
12
-
13
-
14
-
15
-
 16
16 -
 17
17 -
 18
18 -
 19
19 -
 20
20 -
 21
21 -
 22
22 -
 23
23 -
 24
24 -
 25
25 -
 26
26 -
 27
27 -
 28
28 -
 29
29 -
 30
30 -
 31
31 -
 32
32 -
 33
33 -
 34
34 -
 35
35 -
 36
36 -
37
-
38
-
39
-
40
-
41
-
42
-
43
-
44
-
45
-
46
-
47
-
48
-
49
-
50
-
51
-
52
-
53
-
54
-
55
-
56
-
57
-
58
-
59
-
60
-
61
-
62
-
63
-
64
-
65
-
66
-
67
-
68
-
69
-
70
-
71
-
72
-
73
-
74
-
75
-
76
-
77
-
78
-
79
-
80
 |
 |

25
temporary impairments were $862 million during fiscal year 2009, as compared with $312 million during fiscal year
2008 and increased primarily due to declines in equity values as a result of deterioration in equity markets. Net
losses on derivatives increased primarily due to losses on equity, commodity, and interest rate derivatives in fiscal
year 2009 as compared with gains in the prior period. Net losses on foreign currency remeasurements increased due
to the strengthening of the U.S. dollar, particularly in the first half of the fiscal year 2009.
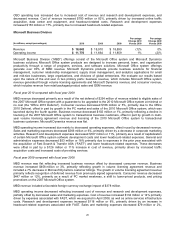
Income Taxes
Fiscal year 2010 compared with fiscal year 2009
Our effective tax rates in fiscal years 2010 and 2009 were 25% and 27%, respectively. The fiscal year 2010 rate
reflects a higher mix of foreign earnings taxed at lower rates.
Fiscal year 2009 compared with fiscal year 2008
Our effective tax rates in fiscal years 2009 and 2008 were 27% and 26%, respectively. While the fiscal year 2009
rate reflects a higher mix of foreign earnings taxed at lower rates, the rate increased from the prior year because the
fiscal year 2008 rate reflects the resolution of tax positions relating to our agreement with the Internal Revenue
Service (“IRS”) settling the 2000-2003 examination, partially offset by the European Commission fine which was not
tax deductible. As a result of the settlement and the impact on subsequent years, we paid the IRS approximately
$4.1 billion during fiscal year 2009.
FINANCIAL CONDITION
Cash, cash equivalents, and short-term investments totaled $36.8 billion as of June 30, 2010, compared with $31.4
billion as of June 30, 2009. Equity and other investments were $7.8 billion as of June 30, 2010, compared with $4.9
billion as of June 30, 2009. Our short-term investments are primarily to facilitate liquidity and for capital preservation.
They consist predominantly of investment grade fixed-income securities, diversified among industries and individual
issuers. The investments are predominantly U.S. dollar-denominated securities, but also include foreign currency-
denominated securities in order to diversify risk.
In general, and where applicable, we use quoted prices in active markets for identical assets or liabilities to
determine fair value. This pricing methodology applies to our Level 1 investments, such as exchange-traded mutual
funds, domestic and international equities, and U.S. treasuries. If quoted prices in active markets for identical assets
or liabilities are not available to determine fair value, then we use quoted prices for similar assets and liabilities or
inputs other than the quoted prices that are observable either directly or indirectly. This pricing methodology applies
to our Level 2 investments such as corporate notes and bonds, foreign government bonds, mortgage-backed
securities, and agency securities. Level 3 investments are valued using internally developed models with
unobservable inputs. Assets and liabilities measured using unobservable inputs are an immaterial portion of our
portfolio.
A majority of our investments are priced by pricing vendors and are generally Level 1 or Level 2 investments as
these vendors either provide a quoted market price in an active market or use observable inputs for their pricing
without applying significant adjustments. Broker pricing is used mainly when a quoted price is not available, the
investment is not priced by our pricing vendors, or when a broker price is more reflective of fair values in the market
in which the investment trades. Our broker-priced investments are generally labeled as Level 2 investments because
the broker prices these investments based on similar assets without applying significant adjustments. In addition, all
of our broker-priced investments have a sufficient level of trading volume to demonstrate that the fair values used are
appropriate for these investments. Our fair value processes include controls that are designed to ensure appropriate
fair values are recorded. These controls include model validation, review of key model inputs, analysis of period-
over-period fluctuations, and independent recalculation of prices where appropriate.
While we own certain mortgage-backed and asset-backed fixed-income securities, our portfolio as of June 30, 2010
does not contain direct exposure to subprime mortgages or structured vehicles that derive their value from subprime
collateral. The majority of the mortgage-backed securities are collateralized by prime residential mortgages and carry
a 100% principal and interest guarantee, primarily from Federal National Mortgage Association, Federal Home Loan
Mortgage Corporation, and Government National Mortgage Association.
We lend certain fixed-income and equity securities to increase investment returns. The loaned securities continue to
be carried as investments on our balance sheet. Cash and/or security interests are received as collateral for the