Microsoft 2010 Annual Report Download - page 28
Download and view the complete annual report
Please find page 28 of the 2010 Microsoft annual report below. You can navigate through the pages in the report by either clicking on the pages listed below, or by using the keyword search tool below to find specific information within the annual report.-
 1
1 -
2
-
3
-
4
-
5
-
6
-
7
-
8
-
9
-
10
-
11
-
12
-
13
-
14
-
15
-
16
-
17
-
 18
18 -
 19
19 -
 20
20 -
 21
21 -
 22
22 -
 23
23 -
 24
24 -
 25
25 -
 26
26 -
 27
27 -
 28
28 -
 29
29 -
 30
30 -
 31
31 -
 32
32 -
 33
33 -
 34
34 -
 35
35 -
 36
36 -
 37
37 -
 38
38 -
39
-
40
-
41
-
42
-
43
-
44
-
45
-
46
-
47
-
48
-
49
-
50
-
51
-
52
-
53
-
54
-
55
-
56
-
57
-
58
-
59
-
60
-
61
-
62
-
63
-
64
-
65
-
66
-
67
-
68
-
69
-
70
-
71
-
72
-
73
-
74
-
75
-
76
-
77
-
78
-
79
-
80
 |
 |

27
Unearned Revenue
Unearned revenue at June 30, 2010 comprised mainly unearned revenue from volume licensing programs.
Unearned revenue from volume licensing programs represents customer billings for multi-year licensing
arrangements paid for either at inception of the agreement or annually at the beginning of each billing coverage
period and accounted for as subscriptions with revenue recognized ratably over the billing coverage period.
Unearned revenue at June 30, 2010 also included payments for: post-delivery support and consulting services to be
performed in the future, Xbox LIVE subscriptions; unspecified upgrades/enhancements of Microsoft Internet Explorer
on a when-and-if-available basis for Windows XP; Microsoft Dynamics business solutions products; technology
guarantee programs, including the 2010 Microsoft Office technology guarantee program; and other offerings for
which we have been paid in advance and earn the revenue when we provide the service or software, or otherwise
meet the revenue recognition criteria.
The following table outlines the expected future recognition of unearned revenue as of June 30, 2010:
(In millions)
Three Months Ending,
September 30, 2010 $ 5,150
December 31, 2010 4,239
March 31, 2011 2,815
June 30, 2011 1,448
Thereafter 1,178
Total $ 14,830
Cash Flows
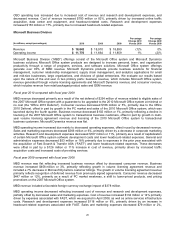
Fiscal year 2010 compared with fiscal year 2009
Cash flow from operations increased $5.0 billion, primarily due to payment of $4.1 billion to the Internal Revenue
Service in the prior year as a result of our settlement of the 2000-2003 audit examination along with increased cash
received from customers in the current year. Cash used for financing increased $5.8 billion, primarily due to a $5.6
billion decrease in net cash proceeds from issuance and repayments of short-term and long-term debt. Financing
activities also included a $1.9 billion increase in cash used for common stock repurchases, which was offset in part
by a $1.7 billion increase in cash received from common stock issued. Cash used for investing decreased $4.5 billion
due to a $3.3 billion decrease in cash used for combined investment purchases, sales, and maturities along with a
$1.1 billion decrease in additions to property and equipment.
Fiscal year 2009 compared with fiscal year 2008
Cash flow from operations decreased $2.6 billion due to payment of approximately $4.1 billion to the IRS in
connection with our settlement of the 2000-2003 audit examination. This impact was partially offset by the fiscal year
2008 payment of the $1.4 billion (€899 million) European Commission fine. Cash used for financing decreased $5.5
billion primarily due to $5.7 billion of net cash proceeds from issuance of short-term and long-term debt in fiscal year
2009. Financing activities also included a $3.2 billion decrease in common stock repurchased, which was offset by a
$2.9 billion decline in common stock issued. Cash used for investing increased $11.2 billion due to a $15.9 billion rise
in purchases of investments along with a $1.7 billion decrease in cash from investment sales and maturities. These
impacts were partially offset by a $7.2 billion decrease in cash paid for acquisition of companies, including the
purchase of aQuantive in fiscal year 2008.
Share Repurchases
On September 22, 2008, we announced the completion of the two repurchase programs approved by our Board of
Directors during the first quarter of fiscal year 2007 (the “2007 Programs”) to buy back up to $40.0 billion of Microsoft
common stock. On September 22, 2008, we also announced that our Board of Directors approved a new share
repurchase program authorizing up to $40.0 billion in share repurchases with an expiration date of September 30,
2013 (the “2008 Program”). As of June 30, 2010, approximately $23.7 billion remained of the $40.0 billion approved
repurchase amount. The repurchase program may be suspended or discontinued at any time without notice.