Nike 2007 Annual Report Download - page 6
Download and view the complete annual report
Please find page 6 of the 2007 Nike annual report below. You can navigate through the pages in the report by either clicking on the pages listed below, or by using the keyword search tool below to find specific information within the annual report.-
 1
1 -
 2
2 -
 3
3 -
 4
4 -
 5
5 -
 6
6 -
 7
7 -
 8
8 -
 9
9 -
 10
10 -
 11
11 -
 12
12 -
 13
13 -
 14
14
 |
 |

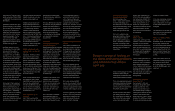
Stock Performance vs. S&P 500
Fiscal Year 2003-2007
S&P 500
43%
111%
NKE
Return on Invested Capital
Fiscal Year 2003-2007
‘03 ‘04 ‘05 ‘06 ‘07
17.8% 21.7% 23.2% 22.6% 22.0%
EPS Performance*
Fiscal Year 2003-2007***
5-Year CAGR 19%**
Revenue Performance
Fiscal Year 2003-2007
5-Year CAGR 11%*
*
Revenue Distribution
Fiscal Year 2003 vs. 2007
48%
International
49%
International
9%
Other Businesses*
14%
Other Businesses*
43%
U.S. 37%
U.S.
*
‘07
$1.38
$1.75
$2.24
$2.64 $2.93
‘03 ‘04 ‘05 ‘06 ‘07
$10,697
$12,253 $13,740 $14,955 $16,326
‘03 ‘04 ‘05 ‘06 ‘07
5-Year CAGR based on Fiscal Year 2002 Revenue of $9,893 million
Revenue in Millions
*EPS based on diluted earnings per share before accounting change
**5-Year CAGR based on Fiscal Year 2002 diluted EPS of $1.23
***EPS amounts prior to Fiscal Year 2007 have been restated to reflect
the two-for-one stock split that occurred in April 2007.
The segment labeled “Other Businesses” represents revenues from Cole
Haan Holdings Incorporated, Hurley International LLC, NIKE Bauer Hockey
Inc., and NIKE Golf for fiscal year 2003, and also includes Converse Inc.,
and Exeter Brands Group LLC for fiscal year 2007.
‘03
ROGER FEDERER