Nintendo 2010 Annual Report Download - page 30
Download and view the complete annual report
Please find page 30 of the 2010 Nintendo annual report below. You can navigate through the pages in the report by either clicking on the pages listed below, or by using the keyword search tool below to find specific information within the annual report.-
 1
1 -
2
-
3
-
4
-
5
-
6
-
7
-
8
-
9
-
10
-
11
-
12
-
13
-
14
-
15
-
16
-
17
-
18
-
19
-
 20
20 -
 21
21 -
 22
22 -
 23
23 -
 24
24 -
 25
25 -
 26
26 -
 27
27 -
 28
28 -
 29
29 -
 30
30 -
 31
31 -
 32
32 -
 33
33 -
 34
34 -
 35
35 -
 36
36 -
 37
37 -
 38
38 -
 39
39 -
 40
40 -
41
-
42
-
43
-
44
-
45
-
46
-
47
-
48
-
49
-
50
-
51
-
52
-
53
-
54
 |
 |

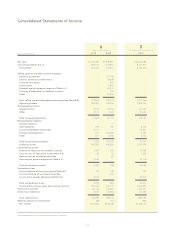
26
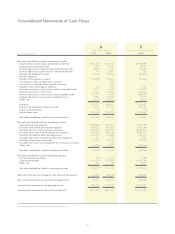
Net cash provided by (used in) operating activities
Income before income taxes and minority interests
Depreciation and amortization
Increase (decrease) in allowance for doubtful accounts
Increase (decrease) in provision for retirement benefits
Interest and dividends income
Interest expenses
Foreign exchange losses (gains)
Loss (gain) on sales of investment securities
Loss (gain) on valuation of investment securities
Equity in losses (earnings) of affiliates
Decrease (increase) in notes and accounts receivable-trade
Decrease (increase) in inventories
Increase (decrease) in notes and accounts payable-trade
Increase (decrease) in accrued consumption taxes
Other, net
Sub-total
Interest and dividends income received
Interest expenses paid
Income taxes paid
Net cash provided by (used in) operating activities
Net cash provided by (used in) investing activities
Payments into time deposits
Proceeds from withdrawal of time deposits
Purchase of short-term investment securities
Proceeds from sales and redemption of securities
Purchase of property, plant and equipment
Proceeds from sales of property, plant and equipment
Purchase of investment securities
Proceeds from sales and redemption of investment securities
Other, net
Net cash provided by (used in) investing activities
Net cash provided by (used in) financing activities
Purchase of treasury stock
Cash dividends paid
Other, net
Net cash provided by (used in) financing activities
Effect of exchange rate change on cash and cash equivalents
Net increase (decrease) in cash and cash equivalents
Cash and cash equivalents at beginning of year
Cash and cash equivalents at end of year (Note 8)
Japanese Yen in Millions
¥U.S. Dollars in Thousands (Note 1)
$
Years ended March 31,
¥367,442
7,098
(2,867)
41
(8,767)
-
(16,888)
-
-
58
3,833
13,380
(50,731)
1,061
(1,825)
311,837
9,595
(2)
(161,091)
160,337
(288,968)
247,925
(566,926)
619,400
(17,127)
135
(1,075)
-
(6,092)
(12,728)
(74)
(134,137)
364
(133,847)
23,442
37,203
894,129
¥931,333
¥448,132
8,102
2,149
5,960
(30,430)
1
98,557
(82)
832
(164)
(4,535)
(57,623)
8,182
(3,003)
(13,381)
462,697
31,477
(1)
(206,373)
287,800
(247,431)
147,391
(496,475)
455,346
(22,956)
28
(12,742)
246
2,229
(174,363)
(364)
(227,458)
168
(227,654)
(95,194)
(209,412)
1,103,542
¥894,129
2010 2009 2010
$3,950,989
76,327
(30,832)
445
(94,273)
-
(181,592)
-
-
633
41,224
143,876
(545,496)
11,410
(19,624)
3,353,086
103,173
(29)
(1,732,167)
1,724,063
(3,107,188)
2,665,868
(6,095,982)
6,660,219
(184,171)
1,457
(11,564)
-
(65,506)
(136,867)
(798)
(1,442,343)
3,921
(1,439,220)
252,066
400,042
9,614,300
$10,014,342
See accompanying notes to consolidated financial statements.
Consolidated Statements of Cash Flows