Nintendo 2010 Annual Report Download - page 50
Download and view the complete annual report
Please find page 50 of the 2010 Nintendo annual report below. You can navigate through the pages in the report by either clicking on the pages listed below, or by using the keyword search tool below to find specific information within the annual report.-
 1
1 -
2
-
3
-
4
-
5
-
6
-
7
-
8
-
9
-
10
-
11
-
12
-
13
-
14
-
15
-
16
-
17
-
18
-
19
-
20
-
21
-
22
-
23
-
24
-
25
-
26
-
27
-
28
-
29
-
30
-
31
-
32
-
33
-
34
-
35
-
36
-
37
-
38
-
39
-
 40
40 -
 41
41 -
 42
42 -
 43
43 -
 44
44 -
 45
45 -
 46
46 -
 47
47 -
 48
48 -
 49
49 -
 50
50 -
 51
51 -
 52
52 -
 53
53 -
 54
54
 |
 |
46
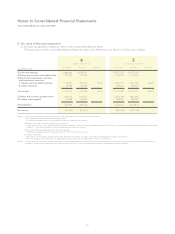
$3.56 $2.29 $10.35 $3.03
U.S. Dollars in Thousands
$
$2,725,787
728,420
455,019
$3,167,317
482,533
292,215
$6,818,476
2,192,673
1,323,752
$2,711,704
547,361
387,459
U.S. Dollars
$
First quarter Fourth quarterThird quarterSecond quarter
First quarter Fourth quarterThird quarterSecond quarter
Japanese Yen in Millions
¥
Net sales
Income before income taxes
Net income
¥253,498
67,743
42,316
¥294,560
44,875
27,176
¥634,118
203,918
123,109
¥252,188
50,904
36,033
Year ended March 31, 2010 First quarter Fourth quarterThird quarterSecond quarter
Japanese Yen
¥
Net income per share ¥330.90 ¥212.51 ¥962.67 ¥281.77
Year ended March 31, 2010
The Commission of the European Communities announced to impose a fine of EUR149 million on October 30, 2002 referring
that Nintendo’s past trade practices in Europe until 1998 fell upon “limitation of competition within the EU common market” which
is prohibited by Article 81 in the EU treaty.
The Company and its consolidated subsidiaries found this fine to be unjustly high and appealed to the Court of First Instance of the
European Communities on January 16, 2003 and were imposed a fine of EUR119 million, a decrease of EUR29 million, on April 30, 2009.
Regarding this judgment, the appeal to the European Court of Justice was not made and thus the judgment was finalized.
Quarterly information of the consolidated fiscal year ended March 31, 2010 was as follows:
Note 22. Others
Japanese Yen in Millions
¥
U.S. Dollars in Thousands
$
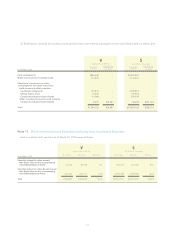
The information of borrowings as of March 31, 2010 and 2009 were as follows:
As for lease obligations, long-term borrowings and other liabilities with interest, excluding due within one year, repayment
schedule for the next five years after the current consolidated closing date are as follows:
Note 21. Supplemental schedule of borrowings
As of March 31, 2010
Lease obligations ¥63 ¥54
Due after one
year through
two years
Due after two
years through
three years
Due after three
years through
four years
¥40 $581
Due after one
year through
two years
Due after two
years through
three years
Due after three
years through
four years
$431 $677
Japanese Yen in Millions
¥
2010 2009
As of March 31,
U.S. Dollars in Thousands
$
2010
Short-term loans payable
Long-term loans payable due within one year
Lease obligations due within one year
Long-term loans payable due after one year
Lease obligations due after one year
Other liabilities with interest
Total
¥125
-
65
-
157
-
¥347
-
-
¥9
-
15
-
¥24
$1,344
-
704
-
1,690
-
$3,739
[Note] The average interest rate of “Short-term loans payable” is 1.2%.
The average interest rates of lease obligations are omitted as the interests equivalent included in total lease payments are allocated to each consolidated fiscal year by straight-line basis.
The due, excluding within one year, of lease obligations falls between April 2011 and September 2013.
First quarter Fourth quarterThird quarterSecond quarter
Years ended March 31, 2010 and 2009
Notes to Consolidated Financial Statements