Nintendo 2012 Annual Report Download - page 21
Download and view the complete annual report
Please find page 21 of the 2012 Nintendo annual report below. You can navigate through the pages in the report by either clicking on the pages listed below, or by using the keyword search tool below to find specific information within the annual report.-
 1
1 -
2
-
3
-
4
-
5
-
6
-
7
-
8
-
9
-
10
-
 11
11 -
 12
12 -
 13
13 -
 14
14 -
 15
15 -
 16
16 -
 17
17 -
 18
18 -
 19
19 -
 20
20 -
 21
21 -
 22
22 -
 23
23 -
 24
24 -
 25
25 -
 26
26 -
 27
27 -
 28
28 -
 29
29 -
 30
30 -
 31
31 -
32
-
33
-
34
-
35
-
36
-
37
-
38
-
39
-
40
-
41
-
42
-
43
-
44
-
45
-
46
-
47
-
48
-
49
-
50
-
51
-
52
-
53
-
54
-
55
-
56
-
57
-
58
-
59
-
60
 |
 |

17
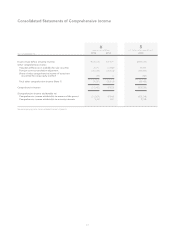
[Note] A: The computation of net income per share of common stock is based on the weighted average number of shares outstanding (excluding treasury stock) during each fiscal year.
B: Cash dividends per share represent the amounts applicable to the respective fiscal years including dividends to be paid after the end of each fiscal year.
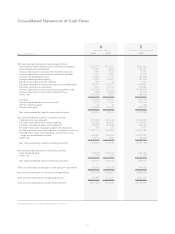
Japanese Yen
¥U.S. Dollars
$
Highest Lowest Highest Lowest
2012 2011 2012
First Quarter
Second Quarter
Third Quarter
Fourth Quarter
$275.24
201.70
152.80
160.00
$176.34
131.46
126.82
120.85
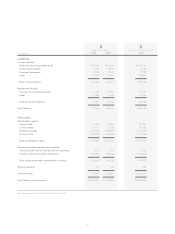
Years ended March 31, Highest Lowest
For the Period
Net sales
Operating income (loss)
Net income (loss)
At the Period-end
Total assets
Property, plant and equipment
Total net assets
Japanese Yen in Millions
¥
Years ended March 31, 2012 2011 2010 2009 2008
Per Share Information
Net income (loss)A
Cash dividendsB
Japanese Yen
¥
Years ended March 31, 2012 2011 2010 2009 2008
U.S. Dollars in Thousands
$
$7,898,200
(455,132)
(526,884)
16,687,829
1,071,423
$14,524,700
2012
U.S. Dollars
$
$(4.12)
$1.21
2012
[Note] The preceding table sets forth the highest and lowest sale prices during the years ended March 31, 2012 and 2011 for Nintendo Co., Ltd. common stock, as reported on the Osaka
Securities Exchange, Section 1. Nintendo Co., Ltd. common stock is also traded on the Tokyo Stock Exchange, Section 1.
¥647,652
(37,320)
(43,204)
1,368,401
87,856
¥1,191,025
¥(337.86)
¥100
¥22,570
16,540
12,530
13,120
¥14,460
10,780
10,400
9,910
¥32,950
27,160
24,670
26,780
¥23,870
20,710
20,180
20,000
¥1,838,622
555,263
279,089
1,810,767
71,064
¥1,253,931
¥1,672,423
487,220
257,342
1,802,490
55,150
¥1,229,973
¥2,182.32
¥1,440
¥2,012.13
¥1,260
¥1,434,365
356,567
228,635
1,760,986
79,586
¥1,336,585
¥1,787.84
¥930
¥1,014,345
171,076
77,621
1,634,297
80,864
¥1,281,861
¥606.99
¥450
Stock Price Information
Five-Year Summary