Nintendo 2012 Annual Report Download - page 44
Download and view the complete annual report
Please find page 44 of the 2012 Nintendo annual report below. You can navigate through the pages in the report by either clicking on the pages listed below, or by using the keyword search tool below to find specific information within the annual report.-
 1
1 -
2
-
3
-
4
-
5
-
6
-
7
-
8
-
9
-
10
-
11
-
12
-
13
-
14
-
15
-
16
-
17
-
18
-
19
-
20
-
21
-
22
-
23
-
24
-
25
-
26
-
27
-
28
-
29
-
30
-
31
-
32
-
33
-
 34
34 -
 35
35 -
 36
36 -
 37
37 -
 38
38 -
 39
39 -
 40
40 -
 41
41 -
 42
42 -
 43
43 -
 44
44 -
 45
45 -
 46
46 -
 47
47 -
 48
48 -
 49
49 -
 50
50 -
 51
51 -
 52
52 -
 53
53 -
 54
54 -
55
-
56
-
57
-
58
-
59
-
60
 |
 |
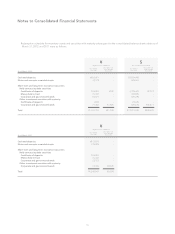
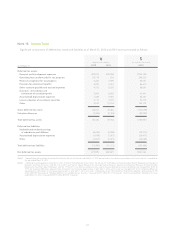
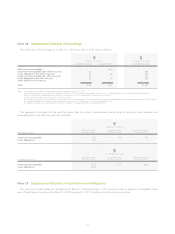
40
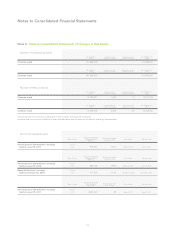
Book value DifferenceAcquisition cost
Japanese Yen in Millions
¥
Securities whose book value on
the accompanying consolidated
balance sheets exceed
their acquisition cost
Equity securities
Debt securities
Other
Sub-total
Securities whose book value on
the accompanying consolidated
balance sheets do not exceed
their acquisition cost
Equity securities
Debt securities
Other
Sub-total
Total
¥10,395
49,330
822
60,548
251
72,483
833
73,569
¥134,117
¥5,674
48,937
821
55,433
261
75,541
834
76,638
¥132,071
¥4,721
392
0
5,114
(9)
(3,057)
(0)
(3,068)
¥2,046
As of March, 2012 Book value DifferenceAcquisition cost
U.S. Dollars in Thousands
$
$126,775
601,590
10,024
738,390
3,071
883,950
10,170
897,193
$1,635,584
$69,195
596,798
10,023
676,017
3,190
921,242
10,179
934,612
$1,610,630
$57,580
4,791
1
62,373
(118)
(37,291)
(9)
(37,419)
$24,953
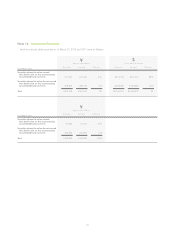
Japanese Yen in Millions
¥
Securities whose book value on
the accompanying consolidated
balance sheets exceed
their acquisition cost
Equity securities
Sub-total
Securities whose book value on
the accompanying consolidated
balance sheets do not exceed
their acquisition cost
Equity securities
Debt securities
Sub-total
Total
¥5,597
5,597
3,841
36,838
40,680
¥46,278
¥1,770
1,770
4,165
41,886
46,052
¥47,822
¥3,827
3,827
(324)
(5,047)
(5,372)
¥(1,544)
As of March, 2011 Book value DifferenceAcquisition cost
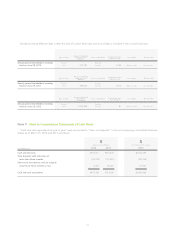
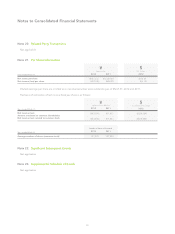
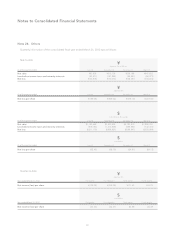
Other securities as of March 31, 2012 and 2011 were as follows:
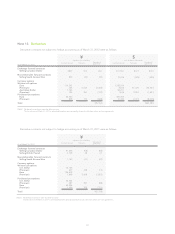
Japanese Yen in Millions
¥
Equity securities ¥28 ¥24 ¥0
Year ended March, 2011 Amount sold Total lossTotal gain
Amount sold Total lossTotal gain
Japanese Yen in Millions
¥
Debt securities
Other
Total
¥473,771
790
¥474,562
¥138
0
¥138
¥14
-
¥14
Year ended March, 2012 Amount sold Total lossTotal gain
U.S. Dollars in Thousands
$
$5,777,703
9,644
$5,787,347
$1,684
0
$1,684
$177
-
$177
Other securities sold during the years ended March 31, 2012 and 2011 were as follows:
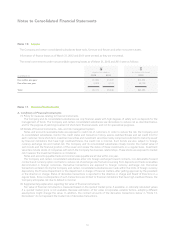
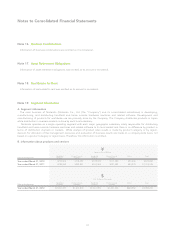
Notes to Consolidated Financial Statements