Proctor and Gamble 2000 Annual Report Download - page 36
Download and view the complete annual report
Please find page 36 of the 2000 Proctor and Gamble annual report below. You can navigate through the pages in the report by either clicking on the pages listed below, or by using the keyword search tool below to find specific information within the annual report.-
 1
1 -
2
-
3
-
4
-
5
-
6
-
7
-
8
-
9
-
10
-
11
-
12
-
13
-
14
-
15
-
16
-
17
-
18
-
19
-
20
-
21
-
22
-
23
-
24
-
25
-
 26
26 -
 27
27 -
 28
28 -
 29
29 -
 30
30 -
 31
31 -
 32
32 -
 33
33 -
 34
34 -
 35
35 -
 36
36 -
 37
37 -
 38
38 -
 39
39 -
 40
40 -
 41
41 -
 42
42 -
 43
43 -
 44
44
 |
 |

The Procter & Gamble Company and Subsidiaries
34
Millions of dollars except per share amounts
NOTES TO CONSOLIDATED FINANCIAL STATEMENTS (CONTINUED)
Currency interest rate swaps, foreign currency instruments and
foreign currency denominated debt that have been designated
as hedges of the Company’s net investment exposure in certain
foreign subsidiaries have notional amounts totaling $7,276 and
$826 at June 30, 2000 and 1999, respectively. These hedges
resulted in gains of $150 and $5, net of $88 and $4 in tax effects,
respectively, reflected in shareholders’ equity.
Credit Risk
Credit risk arising from the inability of a counterparty to meet
the terms of the Company’s financial instrument contracts is gener-
ally limited to the amounts, if any, by which the counterparty’s
obligations exceed the obligations of the Company. It is the
Company’s policy to enter into financial instruments with a diver-
sity of creditworthy counterparties. Therefore, the Company does
not expect to incur material credit losses on its risk management
or other financial instruments.
NOTE 7 STOCK OPTIONS
The Company has stock-based compensation plans under which
stock options are granted annually to key managers and directors
at the market price on the date of grant. The 2000 and 1999
grants are fully exercisable after three years and have a fifteen
year life, while prior years’ grants are fully exercisable after one
year and have a ten year life. Beginning in 1998, the Company
began granting stock options to all eligible employees not covered
by the key manager and director plans. These one-time grants,
which comprised 8.7 million of the 20.3 million options granted in
1998, are fully exercisable after five years and have a ten year life.
The Company issues stock appreciation rights in countries where
stock options are not permitted by local governments.
Pursuant to FASB Statement No. 123, “Accounting for Stock-Based
Compensation,” the Company has elected to account for its em-
ployee stock option plans under APB Opinion No. 25, “Accounting
for Stock Issued to Employees.” Under these plans, stock options
have been issued at fair value and therefore, compensation cost has
not been recognized. Had compensation cost for the plans been
determined based on the fair value at the grant date consistent with
FASB Statement No.123, the Company’s net earnings and earnings
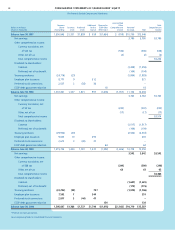
per share would have been as follows:
Years ended June 30
2000 1999 1998
Net earnings
As reported $3,542 $3,763 $3,780
Pro forma 3,363 3,683 3,472
Net earnings per common share
Basic
As reported $ 2.61 $ 2.75 $ 2.74
Pro forma 2.47 2.69 2.51
Diluted
As reported 2.47 2.59 2.56
Pro forma 2.34 2.53 2.35
The fair value of each option grant is estimated on the date of
grant using a binomial option-pricing model with the following
assumptions:
Options Granted in
Years ended June 30
2000 1999 1998
Interest rate 6.0% 5.4% 5.6%
Dividend yield 1.5% 1.5% 2.0%
Expected volatility 28% 26% 26%
Expected life in years 976
Stock option activity was as follows:
Options in Thousands
2000 1999 1998
Outstanding, July 1 76,810 79,918 68,514
Granted 14,360 7,026 20,315
Exercised (7,401) (9,397) (8,477)
Canceled (1,025) (737) (434)
Outstanding, June 30 82,744 76,810 79,918
Exercisable 54,667 61,664 59,610
Available for grant 41,387 39,874 31,558
Average price:
Outstanding, beginning of year $52.11 $45.58 $31.00
Granted 96.10 89.72 83.26
Exercised 25.21 22.36 18.57
Outstanding, end of year 61.73 52.11 45.58
Exercisable, end of year 46.67 43.79 32.74
Weighted average fair value of options
granted during the year 37.21 32.23 24.56