Proctor and Gamble 2000 Annual Report Download - page 41
Download and view the complete annual report
Please find page 41 of the 2000 Proctor and Gamble annual report below. You can navigate through the pages in the report by either clicking on the pages listed below, or by using the keyword search tool below to find specific information within the annual report.-
 1
1 -
2
-
3
-
4
-
5
-
6
-
7
-
8
-
9
-
10
-
11
-
12
-
13
-
14
-
15
-
16
-
17
-
18
-
19
-
20
-
21
-
22
-
23
-
24
-
25
-
26
-
27
-
28
-
29
-
30
-
 31
31 -
 32
32 -
 33
33 -
 34
34 -
 35
35 -
 36
36 -
 37
37 -
 38
38 -
 39
39 -
 40
40 -
 41
41 -
 42
42 -
 43
43 -
 44
44
 |
 |

The Procter & Gamble Company and Subsidiaries
39
Millions of dollars except per share amounts
NOTES TO CONSOLIDATED FINANCIAL STATEMENTS (CONTINUED)
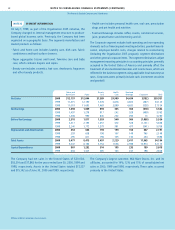
NOTE 13 QUARTERLY RESULTS (UNAUDITED)
Quarters Ended Total
Sept. 30 Dec. 31 Mar. 31 June 30 Year
Net Sales 1999 – 2000 $9,919 $10,588 $9,783 $9,661 $39,951
1998 – 1999 9,510 9,934 9,231 9,450 38,125
Operating Income* 1999 – 2000 1,847 1,842 1,320 945 5,954
1998 – 1999 1,874 1,837 1,665 877 6,253
Net Earnings* 1999 – 2000 1,147 1,126 753 516 3,542
1998 – 1999 1,167 1,142 1,040 414 3,763
Diluted Net Earnings Per Common Share* 1999 – 2000 .80 .78 .52 .36 2.47
1998 – 1999 .80 .78 .72 .29 2.59
FINANCIAL HIGHLIGHTS
2000 1999 1998 1997 1996
Net Sales $39,951 $38,125 $37,154 $35,764 $35,284
Operating Income* 5,954 6,253 6,055 5,488 4,815
Net Earnings* 3,542 3,763 3,780 3,415 3,046
Core Net Earnings 4,230 4,148 3,780 3,415 3,046
Net Earnings Margin* 8.9% 9.9% 10.2% 9.5% 8.6%
Core Net Earnings Margin 10.6% 10.9% 10.2% 9.5% 8.6%
Basic Net Earnings Per Common Share* 2.61 2.75 2.74 2.43 2.14
Diluted Net Earnings Per Common Share* 2.47 2.59 2.56 2.28 2.01
Diluted Core Net Earnings Per Common Share 2.95 2.85 2.56 2.28 2.01
Dividends Per Common Share 1.28 1.14 1.01 .90 .80
Research and Development Expense 1,899 1,726 1,546 1,469 1,399
Advertising Expense 3,667 3,538 3,704 3,466 3,254
Total Assets 34,194 32,113 30,966 27,544 27,730
Capital Expenditures 3,018 2,828 2,559 2,129 2,179
Long-Term Debt 8,916 6,231 5,765 4,143 4,670
Shareholders’ Equity 12,287 12,058 12,236 12,046 11,722
*2000 and 1999 amounts include Organization 2005 program costs.