Proctor and Gamble 2001 Annual Report Download - page 2
Download and view the complete annual report
Please find page 2 of the 2001 Proctor and Gamble annual report below. You can navigate through the pages in the report by either clicking on the pages listed below, or by using the keyword search tool below to find specific information within the annual report.-
 1
1 -
 2
2 -
 3
3 -
 4
4 -
 5
5 -
 6
6 -
 7
7 -
 8
8 -
 9
9 -
 10
10 -
 11
11 -
 12
12 -
 13
13 -
14
-
15
-
16
-
17
-
18
-
19
-
20
-
21
-
22
-
23
-
24
-
25
-
26
-
27
-
28
-
29
-
30
-
31
-
32
-
33
-
34
-
35
-
36
-
37
-
38
-
39
-
40
 |
 |

Amounts in millions except per share amounts Years ended June 30
2001
$39,244
4,736
6,586
2,922
4,397
2.07
3.12
1.40
2000
$39,951
5,954
6,768
3,542
4,230
2.47
2.95
1.28
% Change
-2%
-20%
-3%
-18%
4%
-16%
6%
9%
Net Sales
Operating Income
Core Operating Income†
Net Earnings
Core Net Earnings†
Per Common Share
Diluted Net Earnings
Core Diluted Net Earnings†
Dividends
† Excludes restructuring costs.
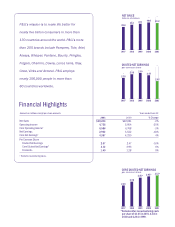
Financial Highlights
NET SALES
billions of dollars
DILUTED NET EARNINGS
per common share
CORE DILUTED NET EARNINGS
per common share
1997 1998 1999 2000 2001
1997 1998 1999 2000 2001
P&G’s mission is to make life better for
nearly five billion consumers in more than
130 countries around the world. P&G’s more
than 250 brands include Pampers, Tide, Ariel,
Always, Whisper, Pantene, Bounty, Pringles,
Folgers, Charmin, Downy, Lenor, Iams, Olay,
Crest, Vicks and Actonel. P&G employs
nearly 106,000 people in more than
80 countries worldwide.
35.8 37.2 38.1 40.0 39.2
2.28
2.56 2.59 2.47
2.07
1997 1998 1999 2000 2001
2.28
2.56
2.85* 2.95* 3.12*
*Excludes after-tax restructuring costs
per share of $1.05 in 2001, $.48 in
2000 and $.26 in 1999.