Samsung 2000 Annual Report Download - page 55
Download and view the complete annual report
Please find page 55 of the 2000 Samsung annual report below. You can navigate through the pages in the report by either clicking on the pages listed below, or by using the keyword search tool below to find specific information within the annual report.-
 1
1 -
2
-
3
-
4
-
5
-
6
-
7
-
8
-
9
-
10
-
11
-
12
-
13
-
14
-
15
-
16
-
17
-
18
-
19
-
20
-
21
-
22
-
23
-
24
-
25
-
26
-
27
-
28
-
29
-
30
-
31
-
32
-
33
-
34
-
35
-
36
-
37
-
38
-
39
-
40
-
41
-
42
-
43
-
44
-
 45
45 -
 46
46 -
 47
47 -
 48
48 -
 49
49 -
 50
50 -
 51
51 -
 52
52 -
 53
53 -
 54
54 -
 55
55 -
 56
56 -
 57
57 -
 58
58 -
 59
59 -
 60
60 -
 61
61 -
 62
62 -
 63
63 -
 64
64 -
 65
65 -
66
-
67
-
68
-
69
-
70
-
71
-
72
-
73
-
74
-
75
-
76
-
77
-
78
-
79
-
80
-
81
-
82
-
83
-
84
-
85
-
86
-
87
-
88
 |
 |

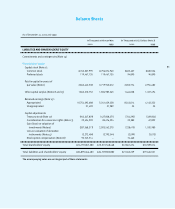
For the years ended December 31, 2000 and 1999
In Thousands of Korean Won In Thousands of U.S. Dollars (Note 3)
2000 1999 2000 1999
Cash flows from investing activities:
Increase in short-term financial instruments (761,536,523) –$(604,874) $–
Decrease in short-term financial instruments – 362,368,502 – 287,823
Proceeds from sale of marketable securities 1,708,799,613 837,207,770 1,357,267 664,978
Acquisition of marketable securities (2,136,393,351) (929,344,062) (1,696,897) (738,160)
Increase in other accounts and notes receivable (5,495,533,634) (2,370,114,943) (4,364,998) (1,882,538)
Decrease in other accounts and notes receivable 5,522,883,460 2,448,959,963 4,386,723 1,945,163
Proceeds from disposal of property,
plant and equipment 52,860,263 399,277,815 209,649 317,139
Acquisition of property, plant and equipment (5,036,923,839) (3,401,866,665) (4,281,161) (2,702,039)
Proceeds from sale of equity investments 142,963,660 258,841,067 113,553 205,593
Acquisition of equity investments (954,452,666) (1,980,667,389) (758,104) (1,573,207)
Increase in long-term financial instruments
and other assets (275,443,541) (609,048,949) (218,780) (483,756)
Decrease in long-term financial instruments
and other assets 550,781,633 790,771,403 437,475 628,095
Other (141,956,097) 3,902,019 11 3,099
Net cash used in investing activities (6,823,951,022) (4,189,713,464) $(5,420,136) $(3,327,810)
Cash flows from financing activities:
Proceeds from short-term borrowings 1,506,859 214,979,206 $1,197 $170,754
Repayment of short-term borrowings (1,542,153) (453,342,931) (1,225) (360,082)
Increase in other accounts and notes payable 15,422,340,509 9,603,870,409 12,249,674 7,628,174
Decrease in other accounts and notes payable (15,297,532,349) (9,046,194,581) (12,150,542) (7,185,222)
Proceeds from long-term debt – 722,407,330 –573,795
Repayment of long-term debt (391,627,375) (3,304,344,477) (311,062) (2,624,579)
Proceeds from bonds – 478,410,000 – 379,992
Repayment of current maturities
of long-term debt (1,398,995,814) (2,064,758,293) (1,111,196) (1,639,999)
Issuance of common stock – 1,567,684,230 – 1,245,182
Payments of dividends (428,543,923) (172,423,703) (340,384) (136,953)
Proceeds from acquisition of treasury stock (534,409,488) – (424,471) –
Other (8,009,728) (84,243,073) (6,362) (66,913)
Net cash used in financing activities (2,636,813,462) (2,537,955,883) $(2,094,371) $(2,015,851)
Net change in cash and cash equivalents (4,946,095) 350,062,794 $(3,929) $278,048
Cash and cash equivalents at beginning of year 526,829,785 176,766,991 418,451 140,403
Cash and cash equivalents at end of year 521,883,690 526,829,785 $414,522 $418,451
The accompanying notes are an integral part of these statements.
Statements of Cash Flows
55