Sprint - Nextel 2010 Annual Report Download - page 134
Download and view the complete annual report
Please find page 134 of the 2010 Sprint - Nextel annual report below. You can navigate through the pages in the report by either clicking on the pages listed below, or by using the keyword search tool below to find specific information within the annual report.-
 1
1 -
2
-
3
-
4
-
5
-
6
-
7
-
8
-
9
-
10
-
11
-
12
-
13
-
14
-
15
-
16
-
17
-
18
-
19
-
20
-
21
-
22
-
23
-
24
-
25
-
26
-
27
-
28
-
29
-
30
-
31
-
32
-
33
-
34
-
35
-
36
-
37
-
38
-
39
-
40
-
41
-
42
-
43
-
44
-
45
-
46
-
47
-
48
-
49
-
50
-
51
-
52
-
53
-
54
-
55
-
56
-
57
-
58
-
59
-
60
-
61
-
62
-
63
-
64
-
65
-
66
-
67
-
68
-
69
-
70
-
71
-
72
-
73
-
74
-
75
-
76
-
77
-
78
-
79
-
80
-
81
-
82
-
83
-
84
-
85
-
86
-
87
-
88
-
89
-
90
-
91
-
92
-
93
-
94
-
95
-
96
-
97
-
98
-
99
-
100
-
101
-
102
-
103
-
104
-
105
-
106
-
107
-
108
-
109
-
110
-
111
-
112
-
113
-
114
-
115
-
116
-
117
-
118
-
119
-
120
-
121
-
122
-
123
-
 124
124 -
 125
125 -
 126
126 -
 127
127 -
 128
128 -
 129
129 -
 130
130 -
 131
131 -
 132
132 -
 133
133 -
 134
134 -
 135
135 -
 136
136 -
 137
137 -
 138
138 -
 139
139 -
 140
140 -
 141
141 -
 142
142
 |
 |

Revenues:
Retail revenue
Wholesale revenue
Other revenue
Total revenues
Cost of goods and services and network costs (exclusive of items shown
separately below)
Operating expenses
Depreciation and amortization
Total operating expenses
Operating loss
Other income (expense), net
Income tax provision
Net loss
Non-controlling interest
Net loss attributable to Clearwire
Year Ended December 31, 2009
United States
$ 238,687
2,503
1,608
242,798
410,849
780,266
190,273
1,381,388
$(1,138,590)
International
$ 30,686
—
974
31,660
17,499
40,924
17,990
76,413
$(44,753)
Total
$ 269,373
2,503
2,582
274,458
428,348
821,190
208,263
1,457,801
(1,183,343)
(69,791)
(712)
(1,253,846)
928,264
$(325,582)
Revenues:
Retail revenue
Wholesale revenue
Other revenue
Total revenues
Cost of goods and services and network costs (exclusive of items shown
separately below)
Operating expenses
Transaction related expenses
Depreciation and amortization
Total operating expenses
Operating loss
Other income (expense), net
Income tax provision
Net loss
Non-controlling interest
Net loss attributable to Clearwire
Year Ended December 31, 2008
United States
$ 17,775
—
—
17,775
131,192
236,468
82,960
56,074
506,694
$(488,919)
International
$ 2,714
—
—
2,714
1,333
3,468
—
2,072
6,873
$(4,159)
Total
$ 20,489
—
—
20,489
132,525
239,936
82,960
58,146
513,567
(493,078)
(37,662)
(61,607)
(592,347)
159,721
$(432,626)
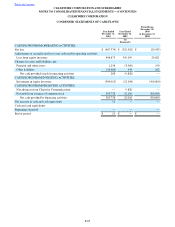
Table of Contents CLEARWIRE CORPORATION AND SUBSIDIARIES
NOTES TO CONSOLIDATED FINANCIAL STATEMENTS —(CONTINUED)
F-77