Sprint - Nextel 2010 Annual Report Download - page 142
Download and view the complete annual report
Please find page 142 of the 2010 Sprint - Nextel annual report below. You can navigate through the pages in the report by either clicking on the pages listed below, or by using the keyword search tool below to find specific information within the annual report.-
 1
1 -
2
-
3
-
4
-
5
-
6
-
7
-
8
-
9
-
10
-
11
-
12
-
13
-
14
-
15
-
16
-
17
-
18
-
19
-
20
-
21
-
22
-
23
-
24
-
25
-
26
-
27
-
28
-
29
-
30
-
31
-
32
-
33
-
34
-
35
-
36
-
37
-
38
-
39
-
40
-
41
-
42
-
43
-
44
-
45
-
46
-
47
-
48
-
49
-
50
-
51
-
52
-
53
-
54
-
55
-
56
-
57
-
58
-
59
-
60
-
61
-
62
-
63
-
64
-
65
-
66
-
67
-
68
-
69
-
70
-
71
-
72
-
73
-
74
-
75
-
76
-
77
-
78
-
79
-
80
-
81
-
82
-
83
-
84
-
85
-
86
-
87
-
88
-
89
-
90
-
91
-
92
-
93
-
94
-
95
-
96
-
97
-
98
-
99
-
100
-
101
-
102
-
103
-
104
-
105
-
106
-
107
-
108
-
109
-
110
-
111
-
112
-
113
-
114
-
115
-
116
-
117
-
118
-
119
-
120
-
121
-
122
-
123
-
124
-
125
-
126
-
127
-
128
-
129
-
130
-
131
-
 132
132 -
 133
133 -
 134
134 -
 135
135 -
 136
136 -
 137
137 -
 138
138 -
 139
139 -
 140
140 -
 141
141 -
 142
142
 |
 |

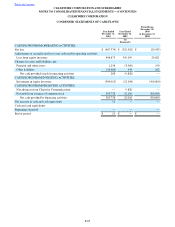
CLEARWIRE CORPORATION
CONDENSED STATEMENTS OF CASH FLOWS
CASH FLOWS FROM OPERATING ACTIVITIES:
Net loss
Adjustments to reconcile net loss to net cash used in operating activities:
Loss from equity investees
Changes in assets and liabilities, net:
Prepaids and other assets
Other liabilities
Net cash provided (used) in operating activities
CASH FLOWS FROM INVESTING ACTIVITIES:
Investment in equity investees
CASH FLOWS FROM FINANCING ACTIVITIES:
Net advances from Clearwire Communications
Proceeds from issuance of common stock
Net cash provided by financing activities
Net increase in cash and cash equivalents
Cash and cash equivalents:
Beginning of period
End of period
Year Ended
December 31,
2010
$(487,374)
496,875
1,256
(10,469)
288
(304,015)
—
303,738
303,738
11
—
$ 11
Year Ended
December 31,
2009
(In
thousands)
$(325,582)
319,199
(3,980)
543
(9,820)
(12,196)
9,820
12,196
22,016
—
—
$ —
Period From
November 29,
2008
to December 31,
2008
$(29,933)
29,621
150
162
—
(500,000)
—
500,000
500,000
—
—
$ —
Table of Contents CLEARWIRE CORPORATION AND SUBSIDIARIES
NOTES TO CONSOLIDATED FINANCIAL STATEMENTS —(CONTINUED)
F-85