Symantec 2001 Annual Report Download - page 15
Download and view the complete annual report
Please find page 15 of the 2001 Symantec annual report below. You can navigate through the pages in the report by either clicking on the pages listed below, or by using the keyword search tool below to find specific information within the annual report.-
 1
1 -
2
-
3
-
4
-
 5
5 -
 6
6 -
 7
7 -
 8
8 -
 9
9 -
 10
10 -
 11
11 -
 12
12 -
 13
13 -
 14
14 -
 15
15 -
 16
16 -
 17
17 -
 18
18 -
 19
19 -
 20
20 -
 21
21 -
 22
22 -
 23
23 -
 24
24 -
 25
25 -
26
-
27
-
28
-
29
-
30
-
31
-
32
-
33
-
34
-
35
-
36
-
37
-
38
-
39
-
40
-
41
-
42
-
43
-
44
-
45
-
46
-
47
-
48
-
49
-
50
-
51
-
52
-
53
-
54
-
55
-
56
-
57
-
58
 |
 |

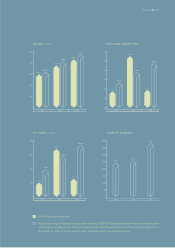
Market Information Common Stock
Our common stock is traded on the Nasdaq National Market under
the symbol “SYMC.”The high and low closing prices are as reported
on the Nasdaq National Market.
Fiscal 2001
Mar. 31 Dec. 31 Sep. 30 Jun. 30
2001 2000 2000 2000
High $ 52.69 $ 45.25 $ 63.69 $ 71.50
Low 33.56 29.81 41.38 52.56
Fiscal 2000
Mar. 31 Dec. 31 Sep. 30 Jun. 30
2000 1999 1999 1999
High $ 80.81 $ 66.44 $ 35.97 $ 28.00
Low 48.06 36.75 25.75 13.00
Delrina exchangeable stock has been traded on the Toronto Stock
Exchange under the symbol “DE”since the acquisition of Delrina by
Symantec on November 22, 1995. The high and low closing sales
prices are in Canadian dollars as reported on the Toronto Stock
Exchange. Delrina exchangeable stock is exchangeable at the option of
the stockholders on a one-for-one basis into our common stock.
Fiscal 2001
Mar. 31 Dec. 31 Sep. 30 Jun. 30
2001 2000 2000 2000
High $ 80.00 $ 67.00 $ 93.00 $ 105.00
Low 58.05 42.50 63.00 79.00
Fiscal 2000
Mar. 31 Dec. 31 Sep. 30 Jun. 30
2000 1999 1999 1999
High $ 116.00 $ 99.00 $ 54.00 $ 40.50
Low 70.00 55.00 38.50 20.00
As of March 31, 2001, there were approximately 986 stockholders
of record, including approximately 21 holders of record of Delrina
exchangeable shares. We have not paid cash dividends in the last
three years.
symantec 2001__13
Quarterly Financial Data
Fiscal 2001 Fiscal 2000
Mar. 31 Dec. 31 Sep. 30 Jun. 30 Mar. 31 Dec. 31 Sep. 30 Jun. 30
(In thousands, except net income (loss)
per share; unaudited) 2001 2000 2000 2000 2000 1999 1999 1999
Net revenues $ 250,606 $ 219,294 $ 192,296 $ 191,358 $ 187,205 $ 200,847 $ 182,535 $ 175,138
Gross margin 212,129 188,356 165,688 163,521 158,196 170,048 151,893 144,515
Amortization of goodwill 48,994 11,965 5,202 5,175 4,493 4,287 5,169 3,935
Acquired in-process research and
development —22,300 ——3,100 —1,200
Restructuring and other expenses 2,382 1,282 ——3,959 2,246 40 2,773
Income, net of expense, from sale
of technologies and
product lines 4,250 5,000 5,284 5,914 7,491 89,967 5,010 4,890
Net income (loss) (27,448) 13,874 39,113 38,397 31,576 89,013 25,832 23,727
Net income (loss) per share -
basic $ (0.37) $ 0.22 $ 0.64 $ 0.63 $ 0.53 $ 1.52 $ 0.45 $ 0.42
diluted $ (0.37) $ 0.21 $ 0.61 $ 0.60 $ 0.49 $ 1.41 $ 0.43 $ 0.41