Tesco 2007 Annual Report Download - page 5
Download and view the complete annual report
Please find page 5 of the 2007 Tesco annual report below. You can navigate through the pages in the report by either clicking on the pages listed below, or by using the keyword search tool below to find specific information within the annual report.-
 1
1 -
 2
2 -
 3
3 -
 4
4 -
 5
5 -
 6
6 -
 7
7 -
 8
8 -
 9
9 -
 10
10 -
 11
11 -
 12
12 -
 13
13 -
 14
14 -
 15
15 -
 16
16 -
17
-
18
-
19
-
20
-
21
-
22
-
23
-
24
-
25
-
26
-
27
-
28
-
29
-
30
-
31
-
32
-
33
-
34
-
35
-
36
-
37
-
38
-
39
-
40
-
41
-
42
-
43
-
44
-
45
-
46
-
47
-
48
-
49
-
50
-
51
-
52
-
53
-
54
-
55
-
56
-
57
-
58
-
59
-
60
-
61
-
62
-
63
-
64
-
65
-
66
-
67
-
68
-
69
-
70
-
71
-
72
-
73
-
74
-
75
-
76
-
77
-
78
-
79
-
80
-
81
-
82
-
83
-
84
-
85
-
86
-
87
-
88
-
89
-
90
-
91
-
92
-
93
-
94
-
95
-
96
-
97
-
98
-
99
-
100
-
101
-
102
-
103
-
104
-
105
-
106
-
107
-
108
-
109
-
110
-
111
-
112
 |
 |

3
OPERATING AND
FINANCIAL REVIEW
Operating and financial review
This Operating and Financial Review (OFR)
analyses the performance of the Tesco Group
in the financial year ended 24 February 2007.
It also explains other aspects of the Group’s
results and operations, including strategy
and risk management.
Long-term strategy
Tesco has a well-established and consistent
strategy for growth, which has allowed us to
strengthen our core UK business and drive
expansion into new markets. Our four part
strategy to diversify the business was laid down
in 1997 and has been the foundation of Tesco’s
success in recent years. The new businesses
which have been created and developed over
the last decade as part of this strategy now have
scale, they are competitive and profitable –
in fact, they make more profit than the entire
Group did in 1997.
The objectives of the strategy are:
• to grow the core UK business;
• to become a successful international retailer;
• to be as strong in non-food as in food; and
• to develop retailing services – such as Tesco
Personal Finance, Telecoms and tesco.com.
In 2006/07, Tesco has again delivered a strong
performance, with all four parts of the strategy
contributing. We have sustained good growth
in the UK and coped well with the challenges
of recovering competitors, rising costs and a
cautious consumer background. In our international
operations we have also made good progress,
completing our largest ever programme of new
store openings and weathered difficult conditions
in some of our largest markets. In non-food,
more customers are choosing to shop with us
even in a period of more cautious consumer
spending and we have launched Tesco Direct,
which extends our reach in selling a broad range
of products on the internet and via catalogue.
Finally, our retailing services have delivered
another good year, with tesco.com sustaining
its rapid growth, Tesco Personal Finance making
progress in challenging markets and Telecoms
continuing to build its customer base strongly.
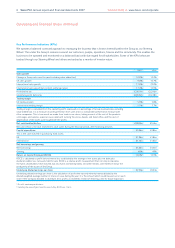
Group summary
2007 2006øChange
£m £m %
Group sales
(including value added tax) 46,611 43,137 8.1
Underlying profit
before tax†2,545 2,277 11.8
Group profit before
taxation 2,653 2,235 18.7
Underlying diluted
earnings per share (p) 22.36 20.30 10.1
Diluted earnings
per share (p) 23.31 19.92 17.0
Dividend per share (p) 9.64 8.63 11.7
UK performance
2007 2006øChange
£m £m %
Sales
(including value added tax) 35,580 32,657 9.0
Operating profit 2,083 1,788 16.5
Trading profit* 1,914 1,752 9.2
Trading margin‡5.9% 5.8%
Rest of Europe performance
2007 2006øChange
£m £m %
Sales
(including value added tax) 6,324 5,820 8.7
Operating profit 324 263 23.2
Trading profit* 318 271 17.3
Trading margin‡5.7% 5.3%
Asia performance
2007 2006øChange
£m £m %
Sales
(including value added tax) 4,707 4,660 1.0
Operating profit 241 229 5.2
Trading profit* 246 238 3.4
Trading margin‡5.6% 5.4%
†Adjusted for IAS 32, IAS 39, the net difference between
the IAS 19 income statement charge and ‘normal’ cash
contributions for pensions, the Pensions Adjustment Finance
Act 2006 and impairment of the Gerrards Cross site.
* Trading Profit is an adjusted measure of operating profit
excluding property-related items and replaces the IAS 19 income
statement charge with ‘normal’ cash contributions for pensions.
‡Trading Margin is calculated using sales excluding value
added tax.
øResults for the year ended 25 February 2006 include 52 weeks
for the UK and the Republic of Ireland and 14 months for the
majority of the remaining International businesses.
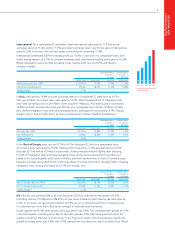
SALES PERFORMANCE
£m
33,557
28,280
26,876
41,819 29,511
46,611 35,580
43,137 32,657
23,101
GROUP
UK
*Including 60 weeks
International
0703 04 05 *06*
03 0504
UK SALES GROWTH %
7.7
9.0
4.0
06
16.314.2 6.7
07
10.7 7.5
11.9 9.0
5.6
TOTAL
LIKE-FOR-LIKE
53rd WEEK