Tesco 2008 Annual Report Download - page 67
Download and view the complete annual report
Please find page 67 of the 2008 Tesco annual report below. You can navigate through the pages in the report by either clicking on the pages listed below, or by using the keyword search tool below to find specific information within the annual report.-
 1
1 -
2
-
3
-
4
-
5
-
6
-
7
-
8
-
9
-
10
-
11
-
12
-
13
-
14
-
15
-
16
-
17
-
18
-
19
-
20
-
21
-
22
-
23
-
24
-
25
-
26
-
27
-
28
-
29
-
30
-
31
-
32
-
33
-
34
-
35
-
36
-
37
-
38
-
39
-
40
-
41
-
42
-
43
-
44
-
45
-
46
-
47
-
48
-
49
-
50
-
51
-
52
-
53
-
54
-
55
-
56
-
 57
57 -
 58
58 -
 59
59 -
 60
60 -
 61
61 -
 62
62 -
 63
63 -
 64
64 -
 65
65 -
 66
66 -
 67
67 -
 68
68 -
 69
69 -
 70
70 -
 71
71 -
 72
72 -
 73
73 -
 74
74 -
 75
75 -
 76
76 -
 77
77 -
78
-
79
-
80
-
81
-
82
-
83
-
84
-
85
-
86
-
87
-
88
-
89
-
90
-
91
-
92
-
93
-
94
-
95
-
96
-
97
-
98
-
99
-
100
-
101
-
102
-
103
-
104
-
105
-
106
-
107
-
108
-
109
-
110
-
111
-
112
 |
 |

Tesco PLC Annual Report and
Financial Statements 2008 65
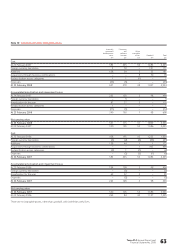
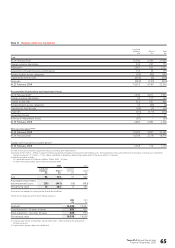
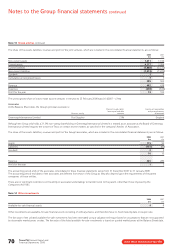
Note 11 Property, plant and equipment
Land and
buildings Other(a) To t a l
£m £m £m
Cost
At 24 February 2007 16,540 5,389 21,929
Foreign currency translation 545 231 776
Additions(b) 2,802 925 3,727
Acquisitions through business combinations 153 26 179
Reclassification across categories (50) (95) (145)
Classified as held for sale (295) (5) (300)
Disposals (485) (131) (616)
At 23 February 2008 19,210 6,340 25,550
Accumulated depreciation and impairment losses
At 24 February 2007 1,942 3,011 4,953
Foreign currency translation 52 117 169
Charge for the year 353 507 860
Reclassification across categories 34 (40) (6)
Classified as held for sale (44) (1) (45)
Disposals (47) (111) (158)
Impairment losses 77 – 77
Reversal of impairment losses (87) – (87)
At 23 February 2008 2,280 3,483 5,763
Net carrying value(c)(d)(e)
At 23 February 2008 16,930 2,857 19,787
At 24 February 2007 14,598 2,378 16,976
Capital work in progress included above(f)
At 23 February 2008 1,058 112 1,170
(a) Other assets consist of plant, equipment, fixtures and fittings and motor vehicles.
(b) Includes £103m (2007 – £78m) in respect of interest capitalised, principally relating to land and building assets. The capitalisation rate used to determine the amount of finance costs capitalised
during the year was 5.1% (2007 – 5.1%). Interest capitalised is deducted in determining taxable profit in the year in which it is incurred.
(c) Net carrying value includes:
(i) Capitalised interest at 23 February 2008 of £790m (2007 – £716m).
(ii) Assets held under finance leases which are analysed below:
2008 2007
Land and Land and
buildings Other(a) buildings Other(a)
£m £m £m £m
Cost 96 723 91 662
Accumulated depreciation
and impairment losses (20) (441) (16) (480)
Net carrying value 76 282 75 182
These assets are pledged as security for the finance lease liabilities.
(d) The net carrying value of land and buildings comprises:
2008 2007
£m £m
Freehold 15,209 13,267
Long leasehold – 50 years or more 892 657
Short leasehold – less than 50 years 829 674
Net carrying value 16,930 14,598
(e) Carrying value of land and buildings includes £6m (2007 – £8m) relating to the prepayment
of lease premiums.
(f) Capital work in progress does not include land.