US Postal Service 2009 Annual Report Download - page 86
Download and view the complete annual report
Please find page 86 of the 2009 US Postal Service annual report below. You can navigate through the pages in the report by either clicking on the pages listed below, or by using the keyword search tool below to find specific information within the annual report.-
 1
1 -
2
-
3
-
4
-
5
-
6
-
7
-
8
-
9
-
10
-
11
-
12
-
13
-
14
-
15
-
16
-
17
-
18
-
19
-
20
-
21
-
22
-
23
-
24
-
25
-
26
-
27
-
28
-
29
-
30
-
31
-
32
-
33
-
34
-
35
-
36
-
37
-
38
-
39
-
40
-
41
-
42
-
43
-
44
-
45
-
46
-
47
-
48
-
49
-
50
-
51
-
52
-
53
-
54
-
55
-
56
-
57
-
58
-
59
-
60
-
61
-
62
-
63
-
64
-
65
-
66
-
67
-
68
-
69
-
70
-
71
-
72
-
73
-
74
-
75
-
 76
76 -
 77
77 -
 78
78 -
 79
79 -
 80
80 -
 81
81 -
 82
82 -
 83
83 -
 84
84 -
 85
85 -
 86
86 -
 87
87 -
 88
88 -
 89
89 -
 90
90 -
 91
91 -
 92
92
 |
 |

84 | 2009 Annual Report United States Postal Service
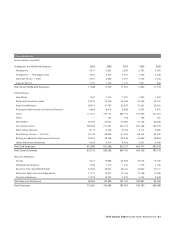
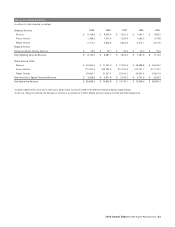
Financial History Summary
(dollars in millions)
Statements of Operations 2009 2008 2007 2006 2005
Total revenue $ 68,116 $ 74,968 $ 74,973 $ 72,817 $ 69,993
Total expense ** 71,910 77,774 80,115 71,917 68,548
Net (Loss) Income $ (3,794) $ (2,806) $ (5,142) $ 900 $ 1,445
Operating revenue $ 68,043 $ 74,829 $ 74,715 $ 72,551 $ 69,798
Revenue foregone 47 103 63 99 109
Total operating revenue 68,090 74,932 74,778 72,650 69,907
Compensation and benefi ts** 53,154 53,585 54,186 54,665 52,449
Retiree health benefi ts ** 3,390 7,407 10,084 1,637 1,495
Other expenses 15,286 16,746 15,835 15,379 14,337
Total operating expenses ** 71,830 77,738 80,105 71,681 68,281
Income from operations (3,740) (2,806) (5,327) 969 1,626
Interest and investment income 26 36 195 167 86
Interest expense deferred retirement — — — (231) (263)
Other interest expense (80) (36) (10) (5) (4)
Net (Loss) Income $ (3,794) $ (2,806) $ (5,142) $ 900 $ 1,445
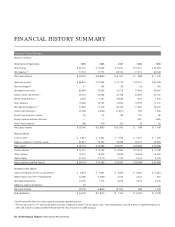
Balance Sheets
Current assets * $ 5,051 $ 2,354 $ 1,859 $ 2,041 $ 1,933
Property, equipment, and other assets 23,067 23,632 23,988 26,447 23,065
Total assets $ 28,118 $ 25,986 $ 25,847 $ 28,488 $ 24,998
Current liabilities * $ 14,121 $ 16,729 $ 13,804 $ 11,613 $ 9,160
Other liabilities * 19,410 10,929 10,909 10,599 10,462
(Defi cit) Equity (5,413) (1,672) 1,134 6,276 5,376
Total Liabilities and Net Capital $ 28,118 $ 25,986 $ 25,847 $ 28,488 $ 24,998
Changes in Net Capital
Capital contributions of the U.S. government $ 3,034 $ 3,034 $ 3,034 $ 3,034 $ 3,034
(Defi cit) Equity since 1971 reorganization (4,706) (1,900) 3,242 2,342 897
Total beginning balance (1,672) 1,134 6,276 5,376 3,931
Additional Capital Contributions 53 ————
Net (loss) Income (3,794) (2,806) (5,142) 900 1,445
Ending Balance $ (5,413) $ (1,672) $ 1,134 $ 6,276 $ 5,376
*Certain reclassifi cations have been made to previously reported amounts.
**The net impact of P.L.111-68 was $4 billion reduction of expense in 2009. The net impact of P.L. 109-435 legislation was $6.8 billion of additional expense in
2007 ($8.4 billion in additional Retiree health benefi ts less $1.6 billion in CSRS savings).
FINANCIAL HISTORY SUMMARY