Walgreens 2006 Annual Report Download - page 22
Download and view the complete annual report
Please find page 22 of the 2006 Walgreens annual report below. You can navigate through the pages in the report by either clicking on the pages listed below, or by using the keyword search tool below to find specific information within the annual report.-
 1
1 -
2
-
3
-
4
-
5
-
6
-
7
-
8
-
9
-
10
-
11
-
 12
12 -
 13
13 -
 14
14 -
 15
15 -
 16
16 -
 17
17 -
 18
18 -
 19
19 -
 20
20 -
 21
21 -
 22
22 -
 23
23 -
 24
24 -
 25
25 -
 26
26 -
 27
27 -
 28
28 -
 29
29 -
 30
30 -
 31
31 -
 32
32 -
33
-
34
-
35
-
36
-
37
-
38
 |
 |

Management’s Discussion and Analysis of Results of Operations
and Financial Condition
Results of Operations
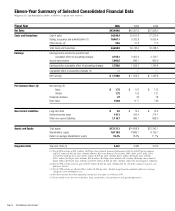
Fiscal 2006 was our 32nd consecutive year of record sales and earnings. Fiscal
year net earnings increased 12.3% to $1.751 billion, or $1.72 per share (diluted),
versus last year’s earnings of $1.560 billion, or $1.52 per share (diluted). Net
earnings increases resulted from improved sales with lower expense ratios,
partially offset by lower gross profit margins.
This year’s results included a $102.5 million pre-tax or $.06 per share (diluted)
charge related to the first quarter adoption of Statement of Financial Accounting
Standards (SFAS) No. 123(R), “Share-Based Payments,” which requires expensing
stock options based on the fair value of those options at the date of the grant.
In the fourth quarter of fiscal year 2005, the company recorded $54.7 million
($.03 per share, diluted) of pre-tax expenses related to Hurricane Katrina, which
hit the Gulf Coast area in late August. These estimates were revised downward
by $12.3 million in fiscal year 2006. Fiscal 2006 also included pre-tax litigation
settlement gains of $7.3 million (less than $.01 per share, diluted) compared to
similar settlements of $26.3 million ($.02 per share, diluted) in fiscal 2005 and
$16.3 million ($.01 per share, diluted) in fiscal 2004.
Net sales increased by 12.3% to $47.409 billion in fiscal 2006 compared to
increases of 12.5% in 2005 and 15.4% in 2004. Drugstore sales increases
resulted from sales gains in existing stores and added sales from new stores, each
of which includes an indeterminate amount of market-driven price changes. Sales
in comparable drugstores were up 7.7% in 2006, 8.2% in 2005 and 10.9% in
2004. Comparable drugstores are defined as those that have been open for at
least twelve consecutive months without closure for seven or more consecutive
days and without a major remodel or a natural disaster in the past twelve months.
Relocated stores are not included as comparable stores for the first twelve months
after the relocation. The company operated 5,461 stores at August 31, 2006,
compared to 4,985 at August 31, 2005 and 4,613 at August 31, 2004.
Prescription sales increased 13.3% in 2006, 13.4% in 2005 and 17.8% in 2004.
Comparable drugstore prescription sales were up 9.2% in 2006, 9.8% in 2005
and 14.0% in 2004. Prescription sales were 64.3% of total net sales for fiscal
2006 compared to 63.7% in 2005 and 63.2% in 2004. The effect of generic
drugs, which have a lower retail price, replacing brand name drugs reduced pre-
scription sales by 2.0% for 2006, 2.4% for 2005 and 1.2% for 2004. Third party
sales, where reimbursement is received from managed care organizations as well
as government and private insurance, were 93.1% of pharmacy sales in 2006,
92.7% in 2005 and 91.7% in 2004. The total number of prescriptions filled for
fiscal 2006 was approximately 529 million; 489 million in fiscal 2005 and 442
million in fiscal 2004.
Front-end sales increased 10.9% in 2006, 11.1% in 2005 and 11.7% in 2004.
Front-end sales were 35.6% of total sales in fiscal 2006, 36.1% in 2005 and
36.5% in 2004. Comparable front-end sales increased 5.3% in 2006, 5.5% in
2005 and 6.1% in 2004.
Gross margins as a percent of total net sales were 27.8% in 2006, 27.9% in
2005 and 27.2% in 2004. The growth in the Walgreens Health Services portion of
the business, with lower gross margins than drugstores, negatively affected gross
profit percents. Pharmacy margins decreased, in part, due to lower gross margin
on Medicare Part D prescription sales. This was largely offset by higher generic
drug utilization, which was aided by the steady stream of new generics over the
past year. The continuing shift in sales mix toward prescriptions, which carry a
lower margin than front-end merchandise, and growth in third party sales, which
typically have lower profit margins than cash prescriptions, continue to adversely
affect gross profit margins. Front-end margins were slightly higher for the year.
We use the last-in, first-out (LIFO) method of inventory valuation. The LIFO provi-
sion is dependent upon inventory levels, inflation rates and merchandise mix. The
effective LIFO inflation rates were 1.53% in 2006, 1.26% in 2005 and .14% in
2004, which resulted in charges to cost of sales of $95.3 million in 2006, $67.8
million in 2005 and $6.7 million in 2004. Inflation on prescription inventory was
2.37% in 2006, 2.18% in 2005 and .72% in 2004. In all three fiscal years, we
experienced deflation in some non-prescription inventories.
Selling, occupancy and administration expenses were 22.1% of sales in fiscal
2006, 22.2% in fiscal 2005 and 21.5% in fiscal 2004. The decrease in fiscal
2006 resulted from a $12.3 million adjustment lowering last fiscal year’s
Introduction
Walgreens is a retail drugstore chain that sells prescription and non-prescription
drugs and general merchandise. General merchandise includes, among other
things, beauty care, personal care, household items, candy, photofinishing, greeting
cards, seasonal items and convenience food. Customers can have prescriptions
filled at the drugstore counter, as well as through the mail, by telephone and on the
Internet. As of August 31, 2006, we operated 5,461 stores (including three mail
service facilities, 38 home care facilities, 18 clinic pharmacies and five specialty
pharmacies) located in 47 states and Puerto Rico.
The drugstore industry is highly competitive. In addition to other drugstore chains,
independent drugstores and mail order prescription providers, we also compete
with various other retailers including grocery stores, convenience stores, mass
merchants and dollar stores.
Prescription sales continue to become a larger portion of the company’s business.
The long-term outlook for prescription sales is strong due in part to the aging
population, the introduction of lower priced generics and the continued develop-
ment of innovative drugs that improve quality of life and control healthcare costs.
As of January 1, 2006, the Medicare Part D prescription drug program went into
effect. This program has resulted in additional prescription sales, although the
gross margin rates on these sales have been lower. The Deficit Reduction Act of
2005 becomes effective during fiscal 2007, and is expected to reduce our
reimbursement for Medicaid generic drugs.
Front-end sales have continued to grow due to strengthening core categories and
new businesses such as digital photo services and the introduction of our new inkjet
printer cartridge refill program. Walgreen private brand sales now comprise 17%
of front-end sales.
We continue to expand into new markets and increase penetration in existing
markets. To support our growth, we are investing significantly in prime locations,
technology and customer service initiatives. Organic growth continues to be our
primary growth vehicle; however, consideration is given to acquisitions that provide
a unique opportunity and strategic fit. In fiscal 2006, for example, we merged with
Happy Harry’s, a drugstore chain with 76 locations, primarily in Delaware. Our
managed care division continues to grow organically, as well as through acquisitions.
Three recent acquisitions include Schraft’s A Specialty Pharmacy, for fertility drugs;
Medmark Inc., a specialty pharmacy business; and SeniorMed LLC, which supplies
medications to assisted living and long-term care institutions.
Operating Statistics
Percentage Increases
Fiscal Year 2006 2005 2004
Net Sales 12.3 12.5 15.4
Net Earnings 12.3 15.5 15.9
Comparable Drugstore Sales 7.7 8.2 10.9
Prescription Sales 13.3 13.4 17.8
Comparable Drugstore Prescription Sales 9.2 9.8 14.0
Front-End Sales 10.9 11.1 11.7
Comparable Front-End Sales 5.3 5.5 6.1
Percent to Sales
Fiscal Year 2006 2005 2004
Gross Margin 27.8 27.9 27.2
Selling, Occupancy and
Administration Expenses 22.1 22.2 21.5
Other Statistics
Fiscal Year 2006 2005 2004
Prescription Sales as a % of Net Sales 64.3 63.7 63.2
Third Party Sales as a % of
Drugstore Prescription Sales 93.1 92.7 91.7
Total Number of Stores
(1)
5,461 4,985 4,613
(1) The total number of stores for fiscal years 2005 and 2004 have been adjusted
to include home care locations for consistency.
Page 20 2006 Walgreens Annual Report