Walmart 1998 Annual Report Download - page 15
Download and view the complete annual report
Please find page 15 of the 1998 Walmart annual report below. You can navigate through the pages in the report by either clicking on the pages listed below, or by using the keyword search tool below to find specific information within the annual report.-
 1
1 -
2
-
3
-
4
-
 5
5 -
 6
6 -
 7
7 -
 8
8 -
 9
9 -
 10
10 -
 11
11 -
 12
12 -
 13
13 -
 14
14 -
 15
15 -
 16
16 -
 17
17 -
 18
18 -
 19
19 -
 20
20 -
 21
21 -
 22
22 -
 23
23 -
 24
24 -
 25
25 -
26
-
27
-
28
-
29
-
30
-
31
-
32
-
33
-
34
-
35
-
36
-
37
-
38
-
39
-
40
 |
 |

15
tion technology. These initiatives
show their value not only in the
financial results of fiscal 1998, but
are designed to continue to deliver
improved results, now and in the
future.
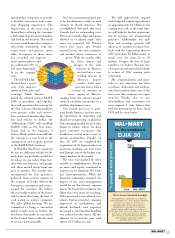
In turn, greater efficiency in the
stores will have a direct impact on
Wal-Mart’s value to shareholders.
An example of how Wal-Mart’s
operational improvements build
returns to investors: Despite a 12
percent increase in sales in 1998, the
company saw only a 4 percent
increase in inventories, saving
about $1.4 billion. This makes
more capital available for other
productive uses.
According to Bob Connolly,
Executive Vice President of
Merchandising, there are four keys
to this dramatic improvement in
inventory management:
1) Systematic reduction of un-
productive inventory
2) Reduction of orders by 15
percent, enabling stores to
manage their own inventory
3) Reduced pack sizes across
many categories
4) Timely markdowns
Rather than blindly slashing
inventory, Wal-Mart has used the
data gathered by technology to
make more inventory available in
the key items that customers want
most, while reducing inventories
overall.
This is where today’s information
technology meets merchandising.
Continuous learning has been a
constant thread in Wal-Mart’s his-
tory, and with modern technology
for understanding what customers
do in the store, we have been able
to focus more precisely on serving
their needs.
Wal-Mart’s record-breaking per-
formance in fiscal 1998 was, as
Coughlin puts it, a matter of focus.
By focusing simultaneously on rais-
ing profits and restraining expenses,
our results show what can happen
when we combine inventory man-
agement, leading-edge technology
and increased financial discipline.
Alabama
Alaska
Arizona
Arkansas
California
Colorado
Connecticut
Delaware
Florida
Georgia
Hawaii
Idaho
Illinois
Indiana
Iowa
Kansas
Kentucky
Louisiana
Maine
Maryland
Massachusetts
Michigan
Minnesota
Mississippi
Missouri
Montana
Nebraska
Nevada
New Hampshire
New Jersey
New Mexico
New York
North Carolina
North Dakota
Ohio
Oklahoma
Oregon
Pennsylvania
Rhode Island
South Carolina
South Dakota
Tennessee
Texas
Utah
Vermont
Virginia
Washington
West Virginia
Wisconsin
Wyoming
GRAND TOTAL
50
3
34
50
100
31
14
2
102
62
5
9
95
60
43
40
45
56
19
22
27
45
34
42
79
9
13
13
17
16
16
51
78
8
77
57
23
49
6
41
8
57
169
14
3
31
20
12
55
9
8
3
7
4
24
10
3
1
31
16
1
1
24
14
7
5
5
9
3
10
3
21
9
4
12
1
3
2
4
6
3
18
14
2
23
6
0
18
1
9
2
11
52
5
0
10
2
3
11
2
27
0
0
27
0
5
0
1
33
25
0
0
11
15
2
8
23
19
0
1
0
0
0
14
30
0
5
0
0
0
3
5
8
0
4
21
0
12
0
12
0
30
72
0
0
21
0
6
1
0
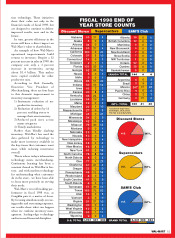
U.S. TOTAL
Supercenters
Supercenters
SAM'S Club
SAM'S Club
FISCAL 1998 END OF
YEAR STORE COUNTS
*Includes 36 Superamas,
62 Bodegas, 33 Aurreras,
178 Vips and 30 Suburbias
Argentina
Brazil
Mexico
Puerto Rico
China
Germany
Alberta
British Columbia
Manitoba
New Brunswick
Newfoundland
Nova Scotia
NW Territories
Ontario
Quebec
Saskatchewan
1,921 441 443 GRAND TOTAL 2,421 502 483
INT'L. TOTAL 500 61 40
CANADA TOTAL 144 0 0
0
0
9
0
0
3
3
28
5
1
0
6
5
27
0
2
21
347*
16
12
9
4
7
7
1
52
28
8
0
0
0
0
0
0
0
0
0
0
0
0
0
0
0
0
0
0
0
0
Discount Stores
Discount Stores
U.S.
U.S. INT'L.
INT'L.
INT'L.
U.S.