Wells Fargo 2013 Annual Report Download - page 166
Download and view the complete annual report
Please find page 166 of the 2013 Wells Fargo annual report below. You can navigate through the pages in the report by either clicking on the pages listed below, or by using the keyword search tool below to find specific information within the annual report.-
 1
1 -
2
-
3
-
4
-
5
-
6
-
7
-
8
-
9
-
10
-
11
-
12
-
13
-
14
-
15
-
16
-
17
-
18
-
19
-
20
-
21
-
22
-
23
-
24
-
25
-
26
-
27
-
28
-
29
-
30
-
31
-
32
-
33
-
34
-
35
-
36
-
37
-
38
-
39
-
40
-
41
-
42
-
43
-
44
-
45
-
46
-
47
-
48
-
49
-
50
-
51
-
52
-
53
-
54
-
55
-
56
-
57
-
58
-
59
-
60
-
61
-
62
-
63
-
64
-
65
-
66
-
67
-
68
-
69
-
70
-
71
-
72
-
73
-
74
-
75
-
76
-
77
-
78
-
79
-
80
-
81
-
82
-
83
-
84
-
85
-
86
-
87
-
88
-
89
-
90
-
91
-
92
-
93
-
94
-
95
-
96
-
97
-
98
-
99
-
100
-
101
-
102
-
103
-
104
-
105
-
106
-
107
-
108
-
109
-
110
-
111
-
112
-
113
-
114
-
115
-
116
-
117
-
118
-
119
-
120
-
121
-
122
-
123
-
124
-
125
-
126
-
127
-
128
-
129
-
130
-
131
-
132
-
133
-
134
-
135
-
136
-
137
-
138
-
139
-
140
-
141
-
142
-
143
-
144
-
145
-
146
-
147
-
148
-
149
-
150
-
151
-
152
-
153
-
154
-
155
-
 156
156 -
 157
157 -
 158
158 -
 159
159 -
 160
160 -
 161
161 -
 162
162 -
 163
163 -
 164
164 -
 165
165 -
 166
166 -
 167
167 -
 168
168 -
 169
169 -
 170
170 -
 171
171 -
 172
172 -
 173
173 -
 174
174 -
 175
175 -
 176
176 -
177
-
178
-
179
-
180
-
181
-
182
-
183
-
184
-
185
-
186
-
187
-
188
-
189
-
190
-
191
-
192
-
193
-
194
-
195
-
196
-
197
-
198
-
199
-
200
-
201
-
202
-
203
-
204
-
205
-
206
-
207
-
208
-
209
-
210
-
211
-
212
-
213
-
214
-
215
-
216
-
217
-
218
-
219
-
220
-
221
-
222
-
223
-
224
-
225
-
226
-
227
-
228
-
229
-
230
-
231
-
232
-
233
-
234
-
235
-
236
-
237
-
238
-
239
-
240
-
241
-
242
-
243
-
244
-
245
-
246
-
247
-
248
-
249
-
250
-
251
-
252
-
253
-
254
-
255
-
256
-
257
-
258
-
259
-
260
-
261
-
262
-
263
-
264
-
265
-
266
-
267
-
268
-
269
-
270
-
271
-
272
 |
 |

Note 6: Loans and Allowance for Credit Losses (continued)
rates than the ones in their draw period. At December 31, 2013,
$274 million, or 7%, of outstanding lines of credit that are in
their amortization period were 30 or more days past due,
compared with $1.5 billion, or 2%, for lines in their draw period.
We have considered this increased inherent risk in our allowance
for credit loss estimate. In anticipation of our borrowers
reaching the end of their contractual commitment, we have
created a program to inform, educate and help these borrowers
transition from interest-only to fully-amortizing payments or full
repayment. We monitor the performance of the borrowers
moving through the program in an effort to refine our ongoing
program strategy.
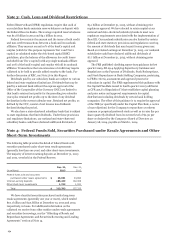
Loan Purchases, Sales, and Transfers
The following table summarizes the proceeds paid or received for
purchases and sales of loans and transfers from loans held for
investment to mortgages/loans held for sale at lower of cost or
market. This loan activity primarily includes loans purchased
and sales of whole loan or participating interests, whereby we
receive or transfer a portion of a loan after origination. The table
excludes PCI loans and loans recorded at fair value, including
loans originated for sale because their loan activity normally
does not impact the allowance for credit losses.
Year ended December 31,
2013 2012
(in millions) Commercial Consumer Total Commercial Consumer Total
Purchases (1) $ 10,914 581 11,495 12,280 167 12,447
Sales (6,740) (514) (7,254) (5,840) (840) (6,680)
Transfers to MHFS/LHFS (1) (258) (11) (269) (84) (21) (105)
(1) The “Purchases” and “Transfers to MHFS/LHFS" categories exclude activity in government insured/guaranteed loans. As servicer, we are able to buy delinquent
insured/guaranteed loans out of the Government National Mortgage Association (GNMA) pools. These loans have different risk characteristics from the rest of our consumer
portfolio, whereby this activity does not impact the allowance for loan losses in the same manner because the loans are predominantly insured by the Federal Housing
Administration (FHA) or guaranteed by the Department of Veterans Affairs (VA). On a net basis, such purchases net of transfers to MHFS were $8.2 billion and $9.8 billion
for the year ended 2013 and 2012, respectively.
164