eBay 2000 Annual Report Download - page 31
Download and view the complete annual report
Please find page 31 of the 2000 eBay annual report below. You can navigate through the pages in the report by either clicking on the pages listed below, or by using the keyword search tool below to find specific information within the annual report.-
 1
1 -
2
-
3
-
4
-
5
-
6
-
7
-
8
-
9
-
10
-
11
-
12
-
13
-
14
-
15
-
16
-
17
-
18
-
19
-
20
-
 21
21 -
 22
22 -
 23
23 -
 24
24 -
 25
25 -
 26
26 -
 27
27 -
 28
28 -
 29
29 -
 30
30 -
 31
31 -
 32
32 -
 33
33 -
 34
34 -
 35
35 -
 36
36 -
 37
37 -
 38
38 -
 39
39 -
 40
40 -
 41
41 -
42
-
43
-
44
-
45
-
46
-
47
-
48
-
49
-
50
-
51
-
52
-
53
-
54
-
55
-
56
-
57
-
58
-
59
-
60
-
61
-
62
-
63
-
64
-
65
-
66
-
67
-
68
-
69
-
70
-
71
-
72
-
73
-
74
-
75
-
76
-
77
-
78
-
79
-
80
-
81
-
82
-
83
-
84
-
85
-
86
-
87
-
88
-
89
-
90
-
91
-
92
 |
 |
operations depending on the timing of auctions and the availability of high quality items from large collections
and estates. ButterÑelds typically has its best operating results in the traditional fall and spring auction seasons
and has historically incurred operating losses in the Ñrst and third quarters. Kruse typically sees a seasonal
peak in operations in the third quarter. Seasonal or cyclical variations in our business may become more
pronounced over time and may harm our results of operations in the future.
Due to the inherent diÇculty in forecasting net revenues, it is also diÇcult to forecast income statement
expense categories as a percentage of net revenues. Quarterly and annual income statement expense categories
as a percentage of net revenues may be signiÑcantly diÅerent from historical or projected rates. As a general
note, we expect costs to increase in absolute dollars across all income statement categories.
To a large extent, the changes in the consolidated results of operations for the periods presented are due
to the growth of the online business, which will be the primary focus of our year-over-year comparisons.
Net Revenues
We derive revenue from a variety of sources including: listing, success and featured item fees, end-to-end
services, commercial alliances, sponsorships and other advertising. In addition, we derive commissions and
rental income from our traditional oÉine auction operations. Our net revenues increased from $86.1 million to
$224.7 million for the years ended December 31, 1998 and 1999 and further increased to $431.4 million in the
year ended December 31, 2000. The successive year-over-year growth from 1998 through 2000 was
predominantly the result of increased use of our website, reÖected in the growth in the number of registered
users, listings and gross merchandise sales. We expect that future revenue growth will be largely driven by the
growth of online services including end-to-end services, commercial alliance revenues and direct advertising.
The Securities and Exchange Commission issued StaÅ Accounting Bulletin (""SAB'') No. 101,
""Revenue Recognition in Financial Statements.'' As it relates to eBay, SAB 101 requires that listing and
featured item fee revenue be recognized ratably over the estimated period of the auction. We implemented
SAB 101 in the Ñrst quarter of 2000, and the eÅect was insigniÑcant.
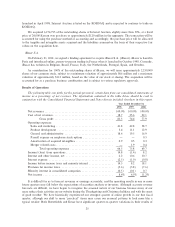
Cost of Net Revenues
Cost of net revenues for online operations consists primarily of costs associated with customer support
and site operations. The costs included are compensation, employee and facilities costs for customer support
and site operations personnel, ISP connectivity charges and depreciation on site equipment. Cost of net
revenues in traditional auction operations primarily includes compensation for auction, appraisal, and
customer support personnel and direct auction costs, such as event site rental. Cost of net revenues increased
from $16.1 million or 18.7% of net revenues to $57.6 million or 25.6% of net revenues for the years ended
December 31, 1998 and 1999 and further increased in absolute dollars but decreased as a percentage of sales
to $95.5 million or 22.1% of net revenues in the year ended December 31, 2000. The successive year-over-year
growth from 1998 through 2000 was due almost entirely to our online business, including our international
operations, as well as our acquisition of Billpoint in 1999 and Half.com in 2000. The increase in absolute
dollars in expenditures for the online service resulted from the continued development and expansion of our
customer support and site operations departments, depreciation of the equipment required for site operations,
software licensing fees and ISP connectivity charges. The decrease in cost of net revenues as a percentage of
net revenue from 1999 to 2000 resulted from cost management in customer support and site operations and
increases in higher gross margin businesses such as autos and end-to-end trading solutions. As a result of these
eÇciencies, we expect the cost of net revenues to increase in absolute dollars but decrease as a percentage of
net revenues in 2001.
Sales and Marketing
Our sales and marketing expenses for both the online and traditional auction businesses are comprised
primarily of compensation for our sales and marketing personnel, advertising, tradeshow and other promo-
tional costs, employee and facilities costs. Sales and marketing expenses increased from $36.0 million or 41.8%
of net revenues to $96.2 million or 42.8% of net revenues for the years ended December 31, 1998 and 1999 and
26