BP 2005 Annual Report Download - page 13
Download and view the complete annual report
Please find page 13 of the 2005 BP annual report below. You can navigate through the pages in the report by either clicking on the pages listed below, or by using the keyword search tool below to find specific information within the annual report.-
 1
1 -
2
-
 3
3 -
 4
4 -
 5
5 -
 6
6 -
 7
7 -
 8
8 -
 9
9 -
 10
10 -
 11
11 -
 12
12 -
 13
13 -
 14
14 -
 15
15 -
 16
16 -
 17
17 -
 18
18 -
 19
19 -
 20
20 -
 21
21 -
 22
22 -
 23
23 -
24
-
25
-
26
-
27
-
28
-
29
-
30
-
31
-
32
-
33
-
34
-
35
-
36
-
37
-
38
-
39
-
40
-
41
-
42
-
43
-
44
-
45
-
46
-
47
-
48
-
49
-
50
-
51
-
52
-
53
-
54
-
55
-
56
-
57
-
58
-
59
-
60
-
61
-
62
-
63
-
64
-
65
-
66
-
67
-
68
-
69
-
70
-
71
-
72
-
73
-
74
-
75
-
76
-
77
-
78
-
79
-
80
-
81
-
82
-
83
-
84
-
85
-
86
-
87
-
88
-
89
-
90
-
91
-
92
-
93
-
94
-
95
-
96
-
97
-
98
-
99
-
100
-
101
-
102
-
103
-
104
-
105
-
106
-
107
-
108
-
109
-
110
-
111
-
112
-
113
-
114
-
115
-
116
-
117
-
118
-
119
-
120
-
121
-
122
-
123
-
124
-
125
-
126
-
127
-
128
-
129
-
130
-
131
-
132
-
133
-
134
-
135
-
136
-
137
-
138
-
139
-
140
-
141
-
142
-
143
-
144
-
145
-
146
-
147
-
148
-
149
-
150
-
151
-
152
-
153
-
154
-
155
-
156
-
157
-
158
-
159
-
160
-
161
-
162
-
163
-
164
-
165
-
166
-
167
-
168
-
169
-
170
-
171
-
172
-
173
-
174
-
175
-
176
-
177
-
178
-
179
-
180
 |
 |

BP Annual Report and Accounts 2005 11
$14,149 million. There were no significant acquisitions
during the year. Capital expenditure and acquisitions were
$16,651 million in 2004, including $1,354 million for TNK’s
interest in Slavneft within TNK-BP and $1,355 million for the
acquisition of Solvay’s interests in BP Solvay Polyethylene
Europe and BP Solvay Polyethylene North America.
Net cash provided by operating activities for 2005 was
$26,721 million, compared with $23,378 million in 2004. In
addition to higher profits, the increase reflects higher dividends
from jointly controlled entities, partially offset by higher
working capital requirements and higher income tax payments.
Net cash used in investing activities was $1,729 million,
compared with $11,331 million in 2004. This reflects capital
expenditure and acquisitions of $13,145 million (2004
$16,379 million), partially offset by disposal proceeds of
$11,200 million (2004 $4,961 million). The net cash proceeds
from the sale of Innovene were $8,304 million after selling
costs, closing adjustments and liabilities assumed by INEOS.
Proceeds from the sale will add to the free cash flow available
for distribution to shareholders.
Net debt, that is, debt less cash and cash equivalents,
was $16,202 million at 31 December 2005, compared with
$21,732 million at 31 December 2004.
The ratio of net debt to net debt plus equity was 17%
at 31 December 2005, compared with 22% at 31 December
2004. This ratio shows the proportion of debt and equity
used to finance our operations and can also be used to
measure borrowing capacity. The ratio of 17% at the end
of 2005 reflects stronger cash flows both from underlying
operations and the sale of Innovene. We continue to believe
that a 20-30% gearing band provides an efficient capital
structure and the appropriate level of financial flexibility.
Our aim is to return gearing to the lower half of the band.
In addition to reported debt, BP uses conventional
off-balance sheet sources of finance such as operating
leases and joint venture and associate borrowings.
BP’s critical accounting policies are highlighted in
Other financial issues on pages 21-24.
BP’s approach to financial risk management, including
the use of derivatives, is described in Other financial issues
on pages 24-26.
DIVIDENDS AND SHARE REPURCHASES
The total dividend paid in 2005 was $7,359 million, compared
with $6,041 million for 2004. The dividend paid per share
was 34.85 cents, an increase of 26% compared with 2004. In
sterling terms, the dividend was also 26% higher. The increase
is the result of our strong cash flow and improvements in
underlying performance in line with strategy.
Our dividend policy is to grow the dividend per share
progressively. In pursuing this policy and in setting the levels
of dividends, the board is guided by several considerations,
including the prevailing circumstances of the group, the
future investment patterns and sustainability of the group
and the trading environment.
We determine the dividend in US dollars, the economic
currency of BP.
BP intends to continue the operation of the Dividend
Reinvestment Plan (DRIP) for shareholders who wish to
Retail margins weakened in 2005 as rising product
prices and price volatility made their impact felt in a
competitive marketplace.
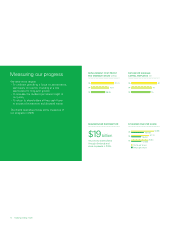
RESULTS
BP’s replacement cost profit for 2005 was $19,314 million,
compared with $15,432 million in 2004. Our profit including
inventory holding gains was $22,341 million, compared
with $17,075 million in 2004. Inventory holding gains or
losses represent the difference between the cost of sales
calculated using the average cost of supplies incurred during
the period and the cost of sales calculated using the first-in
first-out method.
On 16 December 2005, we completed the sale of
Innovene to INEOS. The transaction included manufacturing
sites, markets and technologies.
Our profit figures include a net charge for non-
operating items of $1,754 million in 2005, compared with
$1,072 million in 2004, as shown in the table on page 12.
Non-operating items in 2005 included net fair value
losses on embedded derivatives of $2,047 million, a gain
of more than $1 billion from the sale of our interest in the
Ormen Lange field in Norway and a charge of $700 million
for fatality and personal injury claims resulting from the
incident at our Texas City refinery on 23 March 2005. The
non-operating items related to Innovene primarily consist of
the loss of $591 million on remeasurement to fair value
resulting from its disposal.
Excluding the effects of the non-operating items, the
primary factors contributing to the increase in profit for 2005,
compared with 2004, were higher liquids and gas realizations,
higher refining margins and higher contributions from the gas
marketing and trading and natural gas liquids businesses.
These increases were partly offset by lower retail marketing
margins, higher costs (including those related to hurricanes,
the Thunder Horse incident and the Texas City outage),
planned restructuring actions and significant volatility resulting
under IFRS fair value accounting. Operating incidents at our
Texas City refinery and extreme weather events impacted
our results by an estimated $2 billion post-tax, compared
with 2004. This includes foregone production at prevailing
prices and margins, as well as directly related response and
repair costs. It does not include the charge for the Texas City
fatality and personal injury claims nor Gulf of Mexico Shelf
impairment charges related to hurricane damage, which are
included in the non-operating items above.
Return on average capital employed on a replacement
cost basis was 20%, compared with 16% in 2004; based
on profit including inventory holding gains, it was 23%
(2004 18%).
Finance costs were $616 million, compared with
$440 million in 2004. The increase primarily reflects higher
interest costs, offset by higher capitalized interest. Other
finance expense was $145 million, compared with $340 million
in 2004, primarily reflecting lower net pension costs.
Corporate tax expense was $9,473 million (2004
$7,082 million), representing an effective tax rate of 32% on
replacement cost profit before tax of continuing operations.
Capital expenditure and acquisitions amounted to