BP 2005 Annual Report Download - page 16
Download and view the complete annual report
Please find page 16 of the 2005 BP annual report below. You can navigate through the pages in the report by either clicking on the pages listed below, or by using the keyword search tool below to find specific information within the annual report.-
 1
1 -
2
-
3
-
4
-
5
-
 6
6 -
 7
7 -
 8
8 -
 9
9 -
 10
10 -
 11
11 -
 12
12 -
 13
13 -
 14
14 -
 15
15 -
 16
16 -
 17
17 -
 18
18 -
 19
19 -
 20
20 -
 21
21 -
 22
22 -
 23
23 -
 24
24 -
 25
25 -
 26
26 -
27
-
28
-
29
-
30
-
31
-
32
-
33
-
34
-
35
-
36
-
37
-
38
-
39
-
40
-
41
-
42
-
43
-
44
-
45
-
46
-
47
-
48
-
49
-
50
-
51
-
52
-
53
-
54
-
55
-
56
-
57
-
58
-
59
-
60
-
61
-
62
-
63
-
64
-
65
-
66
-
67
-
68
-
69
-
70
-
71
-
72
-
73
-
74
-
75
-
76
-
77
-
78
-
79
-
80
-
81
-
82
-
83
-
84
-
85
-
86
-
87
-
88
-
89
-
90
-
91
-
92
-
93
-
94
-
95
-
96
-
97
-
98
-
99
-
100
-
101
-
102
-
103
-
104
-
105
-
106
-
107
-
108
-
109
-
110
-
111
-
112
-
113
-
114
-
115
-
116
-
117
-
118
-
119
-
120
-
121
-
122
-
123
-
124
-
125
-
126
-
127
-
128
-
129
-
130
-
131
-
132
-
133
-
134
-
135
-
136
-
137
-
138
-
139
-
140
-
141
-
142
-
143
-
144
-
145
-
146
-
147
-
148
-
149
-
150
-
151
-
152
-
153
-
154
-
155
-
156
-
157
-
158
-
159
-
160
-
161
-
162
-
163
-
164
-
165
-
166
-
167
-
168
-
169
-
170
-
171
-
172
-
173
-
174
-
175
-
176
-
177
-
178
-
179
-
180
 |
 |

14 Making energy more
integrated system of internal control. Details of that process
and the applicable rules are described on pages 131-132.
BP’s total hydrocarbon proved reserves, on an oil
equivalent basis under SORP and including equity-accounted
entities, stood at 18,271mmboe at 31 December 2005. Of
this total, 43% was gas.
The management of our reserves is described under
Other financial issues on pages 22-23.
REFINING AND MARKETING
$ million
2005 2004 2003
Profit before interest and taxa6,942 6,544 3,235
Inventory holding (gains) losses (2,537) (1,304) (43)
Replacement cost profit before interest
and tax 4,405 5,240 3,192
Results include:
Impairment and gain (loss) on sale
of business and fixed assets 84 (456) (214)
Environmental and other provisions (140) (206) (369)
Restructuring, integration and
rationalization costs – (32) (287)
Fair value gain (loss) on
embedded derivatives –––
Other (733) – 10
Total non-operating items (789) (694) (860)
Refinery throughputs (mb/d) 2,399 2,607 2,723
Refining availability (%) 92.9 95.4 95.5
Oil sales volumes (mb/d) 8,692 9,089 9,524
Marketing sales (mb/d) 3,942 4,002 3,969
Global indicator margin ($/bbl) 8.60 6.31 4.08
Chemicals production (kte) 12,367 13,150 12,195
aProfit from continuing operations and includes profit after interest and tax
of equity-accounted entities.
Replacement cost profit before interest and tax for the
segment was $4,405 million, compared with $5,240 million
in 2004. This was affected by the Texas City refinery outage,
adverse impacts related to fair value accounting and costs
associated with rationalization and efficiency programmes.
The full year average GIM was higher than that for the full
year 2004 and consistent with the increase in BP’s actual
realized refining margin. Retail marketing margins, despite
the recovery in the fourth quarter, were significantly lower
than those for the full year 2004, although partly offset
by increases in our other marketing businesses. The
result included a net charge for non-operating items of
$789 million. Of this, $700 million was in respect of fatality
and personal injury claims associated with the incident
at the Texas City refinery on 23 March 2005.
Refining The average GIM was higher in 2005 than in 2004,
owing to the strength of demand and concerns over supply
disruptions, particularly in the US. BP’s refining margin also
reflected the benefits of locational advantages and supply
optimization.
Refining volumes were lower in 2005, owing to the impact
of disposal of the Mersin and Singapore refineries in 2004 and
reduced availability at the Texas City refinery. The latter resulted
from the explosion in the isomerization unit in March 2005 and
the refinery’s complete shutdown in late September, like other
refineries in the area, owing to Hurricane Rita. Subsequent
assessments revealed that this precautionary measure
necessitated additional work to prepare the refinery for a safe
and reliable start-up, prolonging the period of the shutdown.
Following a comprehensive refurbishment, the steam system
at the Texas City refinery was successfully recommissioned in
December 2005. Initial production is expected to commence in
the first quarter of 2006, with further units restarting in a
phased programme, primarily in the second and third quarters.
Refinery throughputs for 2005 were 2,399 thousand barrels
a day (mb/d), compared with 2,607mb/d in 2004.
We have continued to upgrade our refining portfolio.
Following the sale of the Lavéra, France, and Grangemouth,
UK, refineries that were part of Innovene, our refining
portfolio is weighted more heavily to the US, where margins
are structurally higher. Our capital investments continue
to focus on further enhancing our position in the US and
repositioning our European activities by continuing to invest
in upgrading existing facilities.
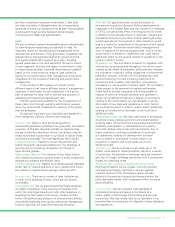
MANUFACTURING COVERAGE
Refineries Aromatics and acetyls
Retail marketing Retail marketing margins were lower
than in 2004, reflecting sustained pressure from rising
crude and product prices. There was also unprecedented
volatility in margins. This was partly due to the effects
of Hurricanes Katrina and Rita on supply and pricing in
the US.
Marketing sales were 3,942mb/d in 2005, compared
with 4,002mb/d the previous year. The decrease was due
mainly to the effects of the price increases as a result of
the supply disruption and market uncertainty. Shop sales
maintained a similar level to those of the previous year,
despite the impact of the rise in fuel prices.
In 2005, the lubricants business was affected by
significantly higher costs of base oil, additives, packaging
and logistics. Marketing volumes were weaker than in 2004
in some developed markets. Volumes continued to grow
in some emerging markets. In 2005, we launched Castrol
Edge passenger car oils, initially in the UK and South
Africa, seeking to bring a new generation of quality-
conscious consumers to the Castrol brand. The range