BP 2012 Annual Report Download - page 14
Download and view the complete annual report
Please find page 14 of the 2012 BP annual report below. You can navigate through the pages in the report by either clicking on the pages listed below, or by using the keyword search tool below to find specific information within the annual report.-
 1
1 -
2
-
3
-
 4
4 -
 5
5 -
 6
6 -
 7
7 -
 8
8 -
 9
9 -
 10
10 -
 11
11 -
 12
12 -
 13
13 -
 14
14 -
 15
15 -
 16
16 -
 17
17 -
 18
18 -
 19
19 -
 20
20 -
 21
21 -
 22
22 -
 23
23 -
 24
24 -
25
-
26
-
27
-
28
-
29
-
30
-
31
-
32
-
33
-
34
-
35
-
36
-
37
-
38
-
39
-
40
-
41
-
42
-
43
-
44
-
45
-
46
-
47
-
48
-
49
-
50
-
51
-
52
-
53
-
54
-
55
-
56
-
57
-
58
-
59
-
60
-
61
-
62
-
63
-
64
-
65
-
66
-
67
-
68
-
69
-
70
-
71
-
72
-
73
-
74
-
75
-
76
-
77
-
78
-
79
-
80
-
81
-
82
-
83
-
84
-
85
-
86
-
87
-
88
-
89
-
90
-
91
-
92
-
93
-
94
-
95
-
96
-
97
-
98
-
99
-
100
-
101
-
102
-
103
-
104
-
105
-
106
-
107
-
108
-
109
-
110
-
111
-
112
-
113
-
114
-
115
-
116
-
117
-
118
-
119
-
120
-
121
-
122
-
123
-
124
-
125
-
126
-
127
-
128
-
129
-
130
-
131
-
132
-
133
-
134
-
135
-
136
-
137
-
138
-
139
-
140
-
141
-
142
-
143
-
144
-
145
-
146
-
147
-
148
-
149
-
150
-
151
-
152
-
153
-
154
-
155
-
156
-
157
-
158
-
159
-
160
-
161
-
162
-
163
-
164
-
165
-
166
-
167
-
168
-
169
-
170
-
171
-
172
-
173
-
174
-
175
-
176
-
177
-
178
-
179
-
180
-
181
-
182
-
183
-
184
-
185
-
186
-
187
-
188
-
189
-
190
-
191
-
192
-
193
-
194
-
195
-
196
-
197
-
198
-
199
-
200
-
201
-
202
-
203
-
204
-
205
-
206
-
207
-
208
-
209
-
210
-
211
-
212
-
213
-
214
-
215
-
216
-
217
-
218
-
219
-
220
-
221
-
222
-
223
-
224
-
225
-
226
-
227
-
228
-
229
-
230
-
231
-
232
-
233
-
234
-
235
-
236
-
237
-
238
-
239
-
240
-
241
-
242
-
243
-
244
-
245
-
246
-
247
-
248
-
249
-
250
-
251
-
252
-
253
-
254
-
255
-
256
-
257
-
258
-
259
-
260
-
261
-
262
-
263
-
264
-
265
-
266
-
267
-
268
-
269
-
270
-
271
-
272
-
273
-
274
-
275
-
276
-
277
-
278
-
279
-
280
-
281
-
282
-
283
-
284
-
285
-
286
-
287
-
288
-
289
-
290
-
291
-
292
-
293
-
294
-
295
-
296
-
297
-
298
-
299
-
300
-
301
-
302
-
303
 |
 |

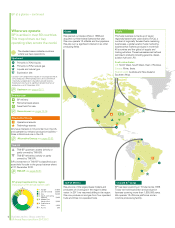
Energy outlook
Looking ahead, we expect demand for energy to grow
and the challenges facing our industry to be met by a diverse mix
of fuels and technologies.
Our market in 2012
World economic growth was weak in 2012 –
below its historic trend – and we expect
subdued global growth to continue in 2013.
Emerging economies with stronger productivity
and rising populations, led by China and India,
are set to drive growth. Developed countries
may lag as they continue to address internal
fiscal imbalances.
Global demand for energy, including oil,
continued to expand modestly in 2012, with
a weak economy and high oil prices weighing
on demand.
As a result, the growth in world oil consumption
remained weak in 2012, with continued growth
in China and other non-OECD countries
offsetting yet another decline in OECD
countries. With oil markets balancing lower
production from certain countries against weak
consumption and high OPEC production,
average crude oil prices in 2012 were similar to
the previous year, averaging $111.67 per barrel.
Natural gas prices continued to diverge globally
in 2012, with lower prices in the US and
increases in Europe and the Far East.
Crude prices
For more information on crude oil and
natural gas prices see page 64.
Globally, refining margins improved on average
as refinery closures and operational issues
reduced product supply. Demand continues to
grow in non-OECD countries but the weak
financial environment in OECD countries has
seen demand growth weaken.
Refining margins
For more information on the BP refining
marker margin and other measures see
page 73.
Concerns about the volatility of commodity
and financial markets, energy security and
climate change have led to continued debate
over the appropriate role of markets,
government regulation and other policy
measures that affect the supply and
consumption of energy. Given the pressures
in the sector, we expect regulation and taxation
of the energy industry and energy users to
increase in many areas in the future.
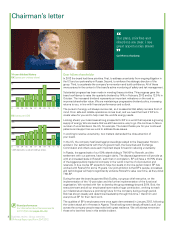
2010 2011 2012
150
125
100
75
50
25
2008 2009
Source: Platts/BP.
*See Downstream on page 73 for further information on RMM.
Dated Brent oil price
Average refining
marker margin (RMM)*
Henry Hub gas price
(First of Month Index)
Crude oil and gas prices, and refining
margins ($ per barrel of oil equivalent)
Business review: Group overview
BP Annual Report and Form 20-F 2012
12