BP 2012 Annual Report Download - page 15
Download and view the complete annual report
Please find page 15 of the 2012 BP annual report below. You can navigate through the pages in the report by either clicking on the pages listed below, or by using the keyword search tool below to find specific information within the annual report.-
 1
1 -
2
-
3
-
4
-
 5
5 -
 6
6 -
 7
7 -
 8
8 -
 9
9 -
 10
10 -
 11
11 -
 12
12 -
 13
13 -
 14
14 -
 15
15 -
 16
16 -
 17
17 -
 18
18 -
 19
19 -
 20
20 -
 21
21 -
 22
22 -
 23
23 -
 24
24 -
 25
25 -
26
-
27
-
28
-
29
-
30
-
31
-
32
-
33
-
34
-
35
-
36
-
37
-
38
-
39
-
40
-
41
-
42
-
43
-
44
-
45
-
46
-
47
-
48
-
49
-
50
-
51
-
52
-
53
-
54
-
55
-
56
-
57
-
58
-
59
-
60
-
61
-
62
-
63
-
64
-
65
-
66
-
67
-
68
-
69
-
70
-
71
-
72
-
73
-
74
-
75
-
76
-
77
-
78
-
79
-
80
-
81
-
82
-
83
-
84
-
85
-
86
-
87
-
88
-
89
-
90
-
91
-
92
-
93
-
94
-
95
-
96
-
97
-
98
-
99
-
100
-
101
-
102
-
103
-
104
-
105
-
106
-
107
-
108
-
109
-
110
-
111
-
112
-
113
-
114
-
115
-
116
-
117
-
118
-
119
-
120
-
121
-
122
-
123
-
124
-
125
-
126
-
127
-
128
-
129
-
130
-
131
-
132
-
133
-
134
-
135
-
136
-
137
-
138
-
139
-
140
-
141
-
142
-
143
-
144
-
145
-
146
-
147
-
148
-
149
-
150
-
151
-
152
-
153
-
154
-
155
-
156
-
157
-
158
-
159
-
160
-
161
-
162
-
163
-
164
-
165
-
166
-
167
-
168
-
169
-
170
-
171
-
172
-
173
-
174
-
175
-
176
-
177
-
178
-
179
-
180
-
181
-
182
-
183
-
184
-
185
-
186
-
187
-
188
-
189
-
190
-
191
-
192
-
193
-
194
-
195
-
196
-
197
-
198
-
199
-
200
-
201
-
202
-
203
-
204
-
205
-
206
-
207
-
208
-
209
-
210
-
211
-
212
-
213
-
214
-
215
-
216
-
217
-
218
-
219
-
220
-
221
-
222
-
223
-
224
-
225
-
226
-
227
-
228
-
229
-
230
-
231
-
232
-
233
-
234
-
235
-
236
-
237
-
238
-
239
-
240
-
241
-
242
-
243
-
244
-
245
-
246
-
247
-
248
-
249
-
250
-
251
-
252
-
253
-
254
-
255
-
256
-
257
-
258
-
259
-
260
-
261
-
262
-
263
-
264
-
265
-
266
-
267
-
268
-
269
-
270
-
271
-
272
-
273
-
274
-
275
-
276
-
277
-
278
-
279
-
280
-
281
-
282
-
283
-
284
-
285
-
286
-
287
-
288
-
289
-
290
-
291
-
292
-
293
-
294
-
295
-
296
-
297
-
298
-
299
-
300
-
301
-
302
-
303
 |
 |

Longer-term outlook
Challenges and opportunities
The world’s population is projected to increase
by 1.3 billion from 2011 to 2030, with real
income likely to double over the same period.
These factors will lead to increased energy
demand and consumption. Energy and climate
policies, efficiency gains and a long-term
structural shift in fast-growing economies away
from industry and towards less energy-intensive
activities will help to restrain any increase, but
the overall trend is likely to be one of strong
growth. We expect demand for energy to
increase by as much as 36% between 2011 and
2030, with nearly 93% of the growth to occur in
non-OECD countries.
We estimate that there are enough energy
resources available to meet the increases in
demand in the foreseeable future, but there will
be challenges as well as opportunities.
Energy security represents a challenge. More
than 60% of the world’s natural gas is
concentrated in just four countries. More than
80% of global oil reserves are located in nine
countries, most of which are well away from the
hubs of energy consumption.
Meeting growing demand for secure and
sustainable energy will also present an
affordability challenge as the availability of easily
accessible fossil fuels slowly diminishes, with
many lower-carbon resources and technologies
remaining costly to produce at scale.
While energy is available to meet growing
demand, action is needed to limit carbon dioxide
(CO2) and other greenhouse gases being
emitted through fossil fuel use. Burning fossil
fuels can also raise local and regional air quality
issues.
Meeting the energy challenge
We believe that, increasingly, the global energy
challenge can only be met through a diverse mix
of fuels and technologies. A broad mix can
enhance national and global energy security
while supporting the transition to a lower-carbon
economy. This is one reason why BP’s portfolio
includes oil sands, shale gas, deepwater oil and
natural gas production, biofuels and wind.
We estimate that today’s oil reserves could
meet more than 45 years of demand at current
consumption rates, while known supplies of
natural gas could meet demand for nearly 60
years and coal could meet demand for up to
120 years.a
Our industry has a track record in expanding the
availability of resources through investment and
the application of technology. For example, in
1981 the world’s oil reserves stood at an
estimated 700 billion barrels. By 2011 this had
risen to 1,650 billion barrels, even though
800 billion barrels had been consumed in the
intervening three decades.
Oil and natural gas
We believe oil and natural gas are likely to
represent about 53% of total energy
consumption in 2030. Even under the
International Energy Agency’s (IEA) most
ambitious climate policy scenario (the 450
scenario), oil and gas would still make up 50%
of the energy mix in 2030, with combined
demand projected to exceed current levels in
absolute terms.b The 450 scenario assumes
governments adopt commitments to limit the
long-term concentration of greenhouse gases in
the atmosphere to 450 parts-per-million of CO2
equivalent.
The facts and figures used in this section are
derived from BP Energy Outlook 2030, published
in January 2013, unless otherwise indicated, and
represent a ‘base case’ or most likely projection.
1.6%per annum
Projected world primary energy
consumption growth to 2030.
a
BP Statistical Review of World Energy June 2012. These
reserve estimates are compiled from official sources and other
third-party data, which may not be based on proved reserves
as defined by SEC rules.
b From World Energy Outlook 2012©, OECD/IEA 2012, page 553.
2020
2030
18
16
14
12
10
8
6
4
2
1990 2000 2010
*Includes biofuels.
Source: BP Energy Outlook 2030.
Hydro Coal
Renewables* Nuclear
Oil
Gas
Energy consumption by fuel
(billion tonnes of oil equivalent)
Energy consumption by region
(billion tonnes of oil equivalent)
2020
2030
18
16
14
12
10
8
6
4
2
1990 2000 2010
Source: BP Energy Outlook 2030.
Non-OECD
OECD
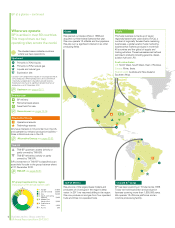
In the US, our biofuels business is focusing on the
development of cellulosic ethanol technology at
facilities in San Diego, California (right) and
Jennings, Louisiana.
Business review: Group overview
BP Annual Report and Form 20-F 2012
13
Business review: Group overview
For more information see
bp.com/energyoutlook