BP 2013 Annual Report Download - page 14
Download and view the complete annual report
Please find page 14 of the 2013 BP annual report below. You can navigate through the pages in the report by either clicking on the pages listed below, or by using the keyword search tool below to find specific information within the annual report.-
 1
1 -
2
-
3
-
 4
4 -
 5
5 -
 6
6 -
 7
7 -
 8
8 -
 9
9 -
 10
10 -
 11
11 -
 12
12 -
 13
13 -
 14
14 -
 15
15 -
 16
16 -
 17
17 -
 18
18 -
 19
19 -
 20
20 -
 21
21 -
 22
22 -
 23
23 -
 24
24 -
25
-
26
-
27
-
28
-
29
-
30
-
31
-
32
-
33
-
34
-
35
-
36
-
37
-
38
-
39
-
40
-
41
-
42
-
43
-
44
-
45
-
46
-
47
-
48
-
49
-
50
-
51
-
52
-
53
-
54
-
55
-
56
-
57
-
58
-
59
-
60
-
61
-
62
-
63
-
64
-
65
-
66
-
67
-
68
-
69
-
70
-
71
-
72
-
73
-
74
-
75
-
76
-
77
-
78
-
79
-
80
-
81
-
82
-
83
-
84
-
85
-
86
-
87
-
88
-
89
-
90
-
91
-
92
-
93
-
94
-
95
-
96
-
97
-
98
-
99
-
100
-
101
-
102
-
103
-
104
-
105
-
106
-
107
-
108
-
109
-
110
-
111
-
112
-
113
-
114
-
115
-
116
-
117
-
118
-
119
-
120
-
121
-
122
-
123
-
124
-
125
-
126
-
127
-
128
-
129
-
130
-
131
-
132
-
133
-
134
-
135
-
136
-
137
-
138
-
139
-
140
-
141
-
142
-
143
-
144
-
145
-
146
-
147
-
148
-
149
-
150
-
151
-
152
-
153
-
154
-
155
-
156
-
157
-
158
-
159
-
160
-
161
-
162
-
163
-
164
-
165
-
166
-
167
-
168
-
169
-
170
-
171
-
172
-
173
-
174
-
175
-
176
-
177
-
178
-
179
-
180
-
181
-
182
-
183
-
184
-
185
-
186
-
187
-
188
-
189
-
190
-
191
-
192
-
193
-
194
-
195
-
196
-
197
-
198
-
199
-
200
-
201
-
202
-
203
-
204
-
205
-
206
-
207
-
208
-
209
-
210
-
211
-
212
-
213
-
214
-
215
-
216
-
217
-
218
-
219
-
220
-
221
-
222
-
223
-
224
-
225
-
226
-
227
-
228
-
229
-
230
-
231
-
232
-
233
-
234
-
235
-
236
-
237
-
238
-
239
-
240
-
241
-
242
-
243
-
244
-
245
-
246
-
247
-
248
-
249
-
250
-
251
-
252
-
253
-
254
-
255
-
256
-
257
-
258
-
259
-
260
-
261
-
262
-
263
-
264
-
265
-
266
-
267
-
268
-
269
-
270
-
271
-
272
-
273
-
274
-
275
-
276
-
277
-
278
-
279
-
280
-
281
-
282
-
283
-
284
-
285
-
286
-
287
-
288
 |
 |

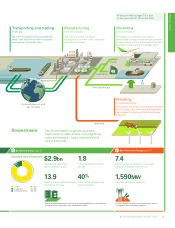
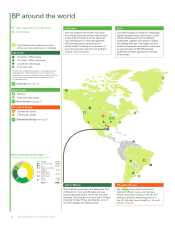
2013 pricing
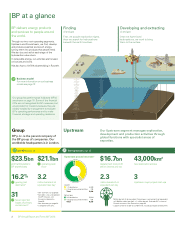
See Upstream on page 26 and
Downstream on page 32.
BP Annual Report and Form 20-F 201310
Population and economic growth are the main
drivers of global energy demand. The world’s
population is projected to increase by 1.7 billion
from 2012 to 2035, with real income likely to
more than double over the same period.
Therefore, the overall trend is likely to be one
of increased energy demand, even with energy
and climate policies and a shift towards less
energy-intense activities in fast-growing
economies. We expect demand for energy
to increase by as much as 41% between
2012 and 2035.
Challenges and opportunities
We seek energy sources that have the following
attributes:
Affordability – meeting growing demand
for secure and sustainable energy presents
an affordability challenge. Fossil fuels will
become increasingly difficult to access and
many lower-carbon resources will remain costly
to produce at scale.
Security – each country knowing where its
supplies will come from. More than 60% of the
world’s known reserves of natural gas are in just
five countries and at least 80% of global oil
reserves are located in nine countries, most of
which are distant from the hubs of energy
consumption. This represents a security
challenge in its own right.
Sustainability – avoiding an unacceptable
environmental and social impact that ultimately
negates the economic benefits. While energy
is available to meet growing demand, action
is needed to limit carbon dioxide (CO2) and
other greenhouse gases emitted through fossil
fuel use.
A diverse mix
We believe a diverse mix of fuels and
technologies can enhance national and global
energy security while supporting the transition
to a lower-carbon economy. These are reasons
why BP’s portfolio includes oil sands, shale gas,
deepwater oil and gas, and biofuels.
Oil and natural gas
Oil and natural gas are likely to play a significant
part in meeting demand for several decades.
We believe these energy sources will represent
about 54% of total energy consumption in 2035.
Even under the International Energy Agency’s
most ambitious climate policy scenario (the 450
scenario), oil and gas would still make up 47%
of the energy mix in 2035.a The 450 scenario
assumes governments adopt commitments to
limit the long-term concentration of greenhouse
gases in the atmosphere to 450 parts-per-million
of CO2 equivalent.
We expect oil to remain the dominant source for
transport fuels, accounting for as much as 87%
of demand in 2035.
Natural gas, in particular, is likely to play an
increasingly strategic role. Shale gas is expected
to contribute 47% of the growth in global natural
gas supplies between 2012 and 2035. The shale
gas revolution has already had a significant
impact on gas prices and demand in the US and
may encourage similar developments elsewhere
although the scale and speed of the roll out of
shale gas technology will vary between
countries. When used in place of coal for power,
natural gas can reduce CO2 emissions by half.
a From World Energy Outlook 2013. © OECD/International
Energy Agency 2013, page 573.
Our market outlook
We believe that a diverse mix of fuels and technologies will
be essential to meet the growing demand for energy and the
challenges facing our industry.
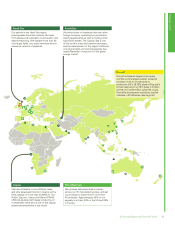
Our third PTA plant in Zhuhai, China, is planned to
begin production in late 2014. It is expected to
bring total capacity at the site to more than 2.7
million tonnes per year.
Thunder Horse in the Gulf of Mexico is one of the
largest integrated offshore drilling and production
platforms in the world.