BP 2014 Annual Report Download - page 6
Download and view the complete annual report
Please find page 6 of the 2014 BP annual report below. You can navigate through the pages in the report by either clicking on the pages listed below, or by using the keyword search tool below to find specific information within the annual report.-
 1
1 -
 2
2 -
 3
3 -
 4
4 -
 5
5 -
 6
6 -
 7
7 -
 8
8 -
 9
9 -
 10
10 -
 11
11 -
 12
12 -
 13
13 -
 14
14 -
 15
15 -
 16
16 -
 17
17 -
18
-
19
-
20
-
21
-
22
-
23
-
24
-
25
-
26
-
27
-
28
-
29
-
30
-
31
-
32
-
33
-
34
-
35
-
36
-
37
-
38
-
39
-
40
-
41
-
42
-
43
-
44
-
45
-
46
-
47
-
48
-
49
-
50
-
51
-
52
-
53
-
54
-
55
-
56
-
57
-
58
-
59
-
60
-
61
-
62
-
63
-
64
-
65
-
66
-
67
-
68
-
69
-
70
-
71
-
72
-
73
-
74
-
75
-
76
-
77
-
78
-
79
-
80
-
81
-
82
-
83
-
84
-
85
-
86
-
87
-
88
-
89
-
90
-
91
-
92
-
93
-
94
-
95
-
96
-
97
-
98
-
99
-
100
-
101
-
102
-
103
-
104
-
105
-
106
-
107
-
108
-
109
-
110
-
111
-
112
-
113
-
114
-
115
-
116
-
117
-
118
-
119
-
120
-
121
-
122
-
123
-
124
-
125
-
126
-
127
-
128
-
129
-
130
-
131
-
132
-
133
-
134
-
135
-
136
-
137
-
138
-
139
-
140
-
141
-
142
-
143
-
144
-
145
-
146
-
147
-
148
-
149
-
150
-
151
-
152
-
153
-
154
-
155
-
156
-
157
-
158
-
159
-
160
-
161
-
162
-
163
-
164
-
165
-
166
-
167
-
168
-
169
-
170
-
171
-
172
-
173
-
174
-
175
-
176
-
177
-
178
-
179
-
180
-
181
-
182
-
183
-
184
-
185
-
186
-
187
-
188
-
189
-
190
-
191
-
192
-
193
-
194
-
195
-
196
-
197
-
198
-
199
-
200
-
201
-
202
-
203
-
204
-
205
-
206
-
207
-
208
-
209
-
210
-
211
-
212
-
213
-
214
-
215
-
216
-
217
-
218
-
219
-
220
-
221
-
222
-
223
-
224
-
225
-
226
-
227
-
228
-
229
-
230
-
231
-
232
-
233
-
234
-
235
-
236
-
237
-
238
-
239
-
240
-
241
-
242
-
243
-
244
-
245
-
246
-
247
-
248
-
249
-
250
-
251
-
252
-
253
-
254
-
255
-
256
-
257
-
258
-
259
-
260
-
261
-
262
-
263
 |
 |

Business model
For more information on our business
model see page 12.
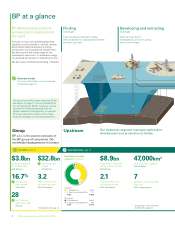
BP at a glance
See Upstream page 24.
Group Upstream Our Upstream segment manages exploration,
development and production activities.
BP p.l.c. is the parent company of
the BP group of companies. Our
worldwide headquarters is in London.
Our group key performance indicators (KPIs)
are shown on page 18. Some financial KPIs
are not recognized GAAP measures, but are
provided for investors because they are
closely tracked by management to evaluate
BP’s operating performance and to make
financial, strategic and operating decisions.
See KPIs page 18.
$8.9bn
replacement cost profit
before interest and tax
2013: $16.7bn
47,000km2
new exploration access
2013: 43,000km2
7
upstream major project★
start-ups
2013: 3 major projects
First, we acquire exploration rights,
then we search for hydrocarbons beneath
the earth’s surface.
Once we have found
hydrocarbons, we work to bring
them to the surface.
Finding
oil and gas
Developing and extracting
oil and gas
BP delivers energy products
and services to people around
the world.
Through our two main operating segments,
Upstream and Downstream, we find, develop
and produce essential sources of energy,
turning them into products that people need.
We also buy and sell at each stage of the
hydrocarbon value chain. In renewable energy,
our activities are focused on biofuels and wind.
We also have a 19.75% shareholding in Rosneft.
2.1
million barrels of oil
equivalent per dayb
2013: 2.3mmboe/d
a See footnote e on page 23.
$3.8bn
profit attributable to
BP shareholders
2013: $23.5bn
3.2
million barrels of oil
equivalent per daya
2013: 3.2mmboe/d
28
tier 1 process
safety events★
2013: 20
$32.8bn
operating cash
flow★
2013: $21.1bn
16.7%
gearing (net
debt ratio)★
2013: 16.2%
1
4
2
3
1. Subsidiaries★ 4,092
2. Equity-accounted entities 717
Total 4,809
Total 6,012
3.
Subsidiaries
5,603
4. Equity-accounted entities 409
Liquids
Natural gas
Upstream proved
reservesb (mmboe)
b Excludes BP’s share of Rosneft.
See Rosneft on page 33.
BP Annual Report and Form 20-F 20142