BP 2014 Annual Report Download - page 7
Download and view the complete annual report
Please find page 7 of the 2014 BP annual report below. You can navigate through the pages in the report by either clicking on the pages listed below, or by using the keyword search tool below to find specific information within the annual report.-
 1
1 -
 2
2 -
 3
3 -
 4
4 -
 5
5 -
 6
6 -
 7
7 -
 8
8 -
 9
9 -
 10
10 -
 11
11 -
 12
12 -
 13
13 -
 14
14 -
 15
15 -
 16
16 -
 17
17 -
 18
18 -
19
-
20
-
21
-
22
-
23
-
24
-
25
-
26
-
27
-
28
-
29
-
30
-
31
-
32
-
33
-
34
-
35
-
36
-
37
-
38
-
39
-
40
-
41
-
42
-
43
-
44
-
45
-
46
-
47
-
48
-
49
-
50
-
51
-
52
-
53
-
54
-
55
-
56
-
57
-
58
-
59
-
60
-
61
-
62
-
63
-
64
-
65
-
66
-
67
-
68
-
69
-
70
-
71
-
72
-
73
-
74
-
75
-
76
-
77
-
78
-
79
-
80
-
81
-
82
-
83
-
84
-
85
-
86
-
87
-
88
-
89
-
90
-
91
-
92
-
93
-
94
-
95
-
96
-
97
-
98
-
99
-
100
-
101
-
102
-
103
-
104
-
105
-
106
-
107
-
108
-
109
-
110
-
111
-
112
-
113
-
114
-
115
-
116
-
117
-
118
-
119
-
120
-
121
-
122
-
123
-
124
-
125
-
126
-
127
-
128
-
129
-
130
-
131
-
132
-
133
-
134
-
135
-
136
-
137
-
138
-
139
-
140
-
141
-
142
-
143
-
144
-
145
-
146
-
147
-
148
-
149
-
150
-
151
-
152
-
153
-
154
-
155
-
156
-
157
-
158
-
159
-
160
-
161
-
162
-
163
-
164
-
165
-
166
-
167
-
168
-
169
-
170
-
171
-
172
-
173
-
174
-
175
-
176
-
177
-
178
-
179
-
180
-
181
-
182
-
183
-
184
-
185
-
186
-
187
-
188
-
189
-
190
-
191
-
192
-
193
-
194
-
195
-
196
-
197
-
198
-
199
-
200
-
201
-
202
-
203
-
204
-
205
-
206
-
207
-
208
-
209
-
210
-
211
-
212
-
213
-
214
-
215
-
216
-
217
-
218
-
219
-
220
-
221
-
222
-
223
-
224
-
225
-
226
-
227
-
228
-
229
-
230
-
231
-
232
-
233
-
234
-
235
-
236
-
237
-
238
-
239
-
240
-
241
-
242
-
243
-
244
-
245
-
246
-
247
-
248
-
249
-
250
-
251
-
252
-
253
-
254
-
255
-
256
-
257
-
258
-
259
-
260
-
261
-
262
-
263
 |
 |

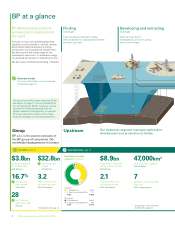
We move hydrocarbons using pipelines,
ships, trucks and trains and we capture
value across the supply chain.
We refine, process and blend
hydrocarbons to make fuels, lubricants
and petrochemicals.
Transporting and trading
oil and gas
Marketing
fuels and products
Manufacturing
fuels and products
We supply our customers with fuel for
transportation, energy for heat and light,
lubricants to keep engines moving and the
petrochemicals required to make a variety
of everyday items.
Investing
in renewable energy
We develop and invest in biofuels and operate
a wind business.
Petrochemicals
International oil and
gas markets
Biofuels
Fuels
Lubricants
See Downstream page 29. Shareholder value
Downstream Our Downstream segment operates
hydrocarbon value chains covering three
main businesses – fuels, lubricants and
petrochemicals.
All data provided on pages 2-5 is at or for the
year ended 31 December 2014.
1. Fuels $32.8bn
2. Lubricants $1.5bn
3. Petrochemicals $4.6bn
$3.7bn
replacement cost profit
before interest and tax
2013: $2.9bn
1.7
million barrels of oil refined
per day
2013: 1.8mmb/d
$5.9bn
dividends paid
41%
of our lubricants sales were
premium grades
2013: 40%
6.0%
ordinary shareholders
annual dividend yield★
6.2%
ADS shareholders
annual dividend yield★
14.0
million tonnes of petrochemicals
produced in the year
2013: 13.9mmte
c This is a non-GAAP measure, but is
provided for investors as it is used by
BP management to make financial
and strategic decisions. See page 210.
1
3
2
Operating capital
employed c
★ Defined on page 252. BP Annual Report and Form 20-F 2014 3
Strategic report