Best Buy 2003 Annual Report Download - page 7
Download and view the complete annual report
Please find page 7 of the 2003 Best Buy annual report below. You can navigate through the pages in the report by either clicking on the pages listed below, or by using the keyword search tool below to find specific information within the annual report.-
 1
1 -
 2
2 -
 3
3 -
 4
4 -
 5
5 -
 6
6 -
 7
7 -
 8
8 -
 9
9 -
 10
10 -
 11
11 -
 12
12 -
 13
13 -
 14
14 -
 15
15 -
 16
16 -
 17
17 -
 18
18 -
19
-
20
-
21
-
22
-
23
-
24
-
25
-
26
-
27
-
28
-
29
-
30
-
31
-
32
-
33
-
34
-
35
-
36
-
37
-
38
-
39
-
40
-
41
-
42
-
43
-
44
-
45
-
46
-
47
-
48
-
49
-
50
-
51
-
52
-
53
-
54
-
55
-
56
-
57
-
58
-
59
-
60
-
61
-
62
-
63
-
64
-
65
-
66
-
67
-
68
-
69
-
70
-
71
-
72
-
73
-
74
-
75
-
76
-
77
-
78
-
79
-
80
-
81
-
82
-
83
-
84
-
85
-
86
-
87
-
88
-
89
-
90
-
91
-
92
-
93
-
94
-
95
-
96
-
97
-
98
-
99
-
100
-
101
-
102
-
103
-
104
-
105
-
106
-
107
-
108
-
109
-
110
-
111
-
112
-
113
-
114
-
115
-
116
-
117
-
118
-
119
-
120
-
121
-
122
-
123
-
124
-
125
-
126
-
127
-
128
-
129
-
130
-
131
-
132
-
133
-
134
-
135
-
136
-
137
-
138
-
139
-
140
-
141
-
142
-
143
-
144
-
145
-
146
-
147
-
148
-
149
-
150
-
151
-
152
-
153
-
154
-
155
-
156
-
157
-
158
-
159
-
160
-
161
-
162
-
163
-
164
-
165
-
166
-
167
-
168
-
169
-
170
-
171
-
172
-
173
-
174
-
175
-
176
-
177
-
178
-
179
-
180
-
181
-
182
-
183
 |
 |
approximately 80 new stores, most of which will be located in existing markets. We believe that continuing to grow our store base
and locating our stores in desirable geographic markets are essential to our future success.
Additional information regarding our Outlook for Fiscal 2004 is included in Management’s Discussion and Analysis of Results of
Operations and Financial Condition on page 37 of our Annual Report, incorporated herein by reference.
Customers
We do not have a significant concentration of sales with any individual customer and, therefore, the loss of any one customer would
not have a material impact on our business. No single customer accounts for 10% or more of our total revenue.
Suppliers
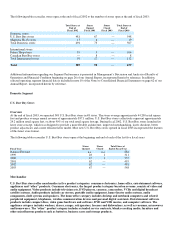
Our strategy depends, in part, upon our ability to offer customers a broad selection of name−brand products and, therefore, our success
is dependent upon satisfactory and stable supplier relationships. In fiscal 2003, our 20 largest suppliers accounted for over half of the
merchandise we purchased, with five suppliers – Sony, Hewlett−Packard, Toshiba, Panasonic and Samsung – representing
approximately one−third of total merchandise purchased. The loss of or disruption in supply from any one of these major suppliers
could have a material adverse effect on our revenue and profits. We generally do not have long−term written contracts with our major
suppliers. We have no indication that any of our suppliers will discontinue selling us merchandise. We have not experienced
significant difficulty in maintaining satisfactory sources of supply, and we generally expect that adequate sources of supply will
continue to exist for the types of merchandise sold in our stores.
Working Capital
We fund the growth of our business through a combination of existing cash and cash equivalents and cash flows generated from
continuing operations. In addition, our revolving credit facilities are available for additional working capital needs or investment
opportunities.
Additional information on our Liquidity and Capital Resources is included in Management’s Discussion and Analysis of Results of
Operations and Financial Condition beginning on page 31 of our Annual Report, incorporated herein by reference.
Available Information
We are subject to the reporting requirements of the Exchange Act and its rules and regulations. The Exchange Act requires us to file
reports, proxy statements and other information with the SEC. Copies of these reports, proxy statements and other information can be
inspected and copied at:
SEC Public Reference Room
450 Fifth Street, N.W.
Washington, D.C. 20549
You may obtain information on the operation of the Public Reference Room by calling the SEC at 1−800−SEC−0330.
You may also obtain these materials electronically by accessing the SEC’s home page on the Internet at:
http://www.sec.gov
In addition, we make available, free of charge on our Internet Web site, our Annual Report on Form 10−K, Quarterly Reports on Form
10−Q, Current Reports on Form 8−K, and amendments to these reports filed or furnished pursuant to Section 13(a) or 15(d) of the
Exchange Act as soon as reasonably practicable after we electronically file this material with, or furnish it to, the SEC. You may
review these documents, under the heading “Investor Relations,” by accessing our Web site:
http://www.BestBuy.com
Also, reports and other information concerning us are available for inspection and copying at:
New York Stock Exchange
20 Broad Street
New York, NY 10005
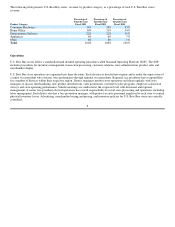
Reportable Operating Segments
During fiscal 2003, we had two reportable operating segments: Domestic and International. At the end of fiscal 2003, the
Domestic segment included U.S. Best Buy and Magnolia Hi−Fi stores. U.S. Best Buy stores offer a wide variety of consumer
electronics, home−office equipment, entertainment software and appliances, and operated 548 stores in 48 states at the end of
fiscal 2003. Magnolia Hi−Fi is a high−end retailer of audio and video products and had 19 stores in Washington, Oregon and
California at March 1, 2003. The International segment was established in connection with our acquisition of Future Shop in
November of fiscal 2002. At the end of fiscal 2003, the International segment consisted of 104 Future Shop stores operating in