Cathay Pacific 2014 Annual Report Download - page 105
Download and view the complete annual report
Please find page 105 of the 2014 Cathay Pacific annual report below. You can navigate through the pages in the report by either clicking on the pages listed below, or by using the keyword search tool below to find specific information within the annual report.-
 1
1 -
2
-
3
-
4
-
5
-
6
-
7
-
8
-
9
-
10
-
11
-
12
-
13
-
14
-
15
-
16
-
17
-
18
-
19
-
20
-
21
-
22
-
23
-
24
-
25
-
26
-
27
-
28
-
29
-
30
-
31
-
32
-
33
-
34
-
35
-
36
-
37
-
38
-
39
-
40
-
41
-
42
-
43
-
44
-
45
-
46
-
47
-
48
-
49
-
50
-
51
-
52
-
53
-
54
-
55
-
56
-
57
-
58
-
59
-
60
-
61
-
62
-
63
-
64
-
65
-
66
-
67
-
68
-
69
-
70
-
71
-
72
-
73
-
74
-
75
-
76
-
77
-
78
-
79
-
80
-
81
-
82
-
83
-
84
-
85
-
86
-
87
-
88
-
89
-
90
-
91
-
92
-
93
-
94
-
 95
95 -
 96
96 -
 97
97 -
 98
98 -
 99
99 -
 100
100 -
 101
101 -
 102
102 -
 103
103 -
 104
104 -
 105
105 -
 106
106 -
 107
107 -
 108
108 -
 109
109 -
 110
110 -
 111
111 -
 112
112
 |
 |

ANNUAL REPORT 2014
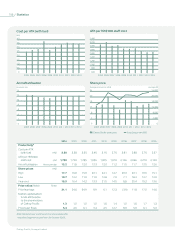
103 Statistics
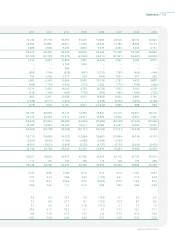
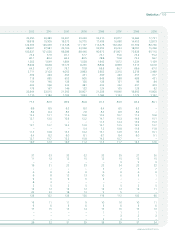
2012 2011 2010 2009 2008 2007 2006 2005
70,133 67,778 59,354 45,920 57,964 49,520 38,755 32,005
24,555 25,980 25,901 17,255 24,623 21,783 18,385 15,773
4,688 4,648 4,269 3,803 3,976 4,055 3,643 3,131
99,376 98,406 89,524 66,978 86,563 75,358 60,783 50,909
(97,763) (93,125) (78,672) (62,583) (94,911) (67,831) (55,687) (46,934)
Operating profit/(loss) 1,613 5,281 10,852 4,395 (8,348) 7,527 5,096 3,975
– – 2,165 1,254 – – – –
– – 868 – – – – –
(884) (744) (978) (847) (1,012) (787) (465) (444)
Share of profits/(losses) of associates 754 1,708 2,577 264 (764) 1,057 301 269
Profit/(loss) before taxation 1,483 6,245 15,484 5,066 (10,124) 7,797 4,932 3,800
(409) (779) (1,441) (275) 1,366 (775) (769) (482)
Profit/(loss) for the year 1,074 5,466 14,043 4,791 (8,758) 7,022 4,163 3,318
(212) (169) (185) (170) (224) (187) (183) (170)
Profit/(loss) attributable to the shareholders of Cathay Pacific 862 5,297 13,858 4,621 (8,982) 6,835 3,980 3,148
(1,338) (3,777) (1,691) – (2,438) (2,245) (2,992) (2,196)
(476) 1,520 12,167 4,621 (11,420) 4,590 988 952
93,703 82,099 74,116 73,345 73,821 70,170 65,351 50,416
24,776 23,393 17,512 14,321 14,504 15,923 12,452 7,230
(59,546) (43,335) (39,629) (42,642) (40,280) (36,368) (31,943) (22,455)
24,182 19,597 24,194 16,511 15,082 21,637 15,595 13,405
(35,364) (23,738) (15,435) (26,131) (25,198) (14,731) (16,348) (9,050)
(excluding liquid funds, bank overdrafts and current portion of borrowings) (15,711) (16,685) (14,022) (12,864) (16,887) (13,094) (9,019) (6,767)
(3,205) (3,650) (1,700) (1,086) (5,509) (1,222) – –
(8,061) (6,651) (5,842) (5,255) (4,737) (6,752) (6,550) (6,470)
56,138 54,768 54,629 42,330 35,994 50,294 45,886 35,359
Financed by:
56,021 54,633 54,476 42,182 35,878 50,116 45,731 35,073
117 135 153 148 116 178 155 286
56,138 54,768 54,629 42,330 35,994 50,294 45,886 35,359
14.24 13.89 13.85 10.72 9.12 12.72 11.62 10.37
EBITDA 2.31 3.34 5.80 2.95 (1.00) 3.41 2.75 2.44
Earnings/(loss) 21.9 134.7 352.3 117.5 (228.3) 173.5 112.9 93.2
0.08 0.52 1.11 0.10 0.03 0.84 0.84 0.48
Profit/(loss) margin 0.9 5.4 15.5 6.9 (10.4) 9.1 6.5 6.2
2.3 8.4 21.7 8.7 (12.3) 12.3 8.7 8.5
2.7 2.6 3.2 11.8 (76.1) 2.1 1.2 1.9
20.9 41.7 35.2 5.1 3.7 14.2 15.1 17.1
Gross debt/equity ratio 1.06 0.79 0.73 1.01 1.12 0.73 0.70 0.64
Net debt/equity ratio 0.63 0.43 0.28 0.62 0.70 0.29 0.36 0.26