Cathay Pacific 2014 Annual Report Download - page 53
Download and view the complete annual report
Please find page 53 of the 2014 Cathay Pacific annual report below. You can navigate through the pages in the report by either clicking on the pages listed below, or by using the keyword search tool below to find specific information within the annual report.-
 1
1 -
2
-
3
-
4
-
5
-
6
-
7
-
8
-
9
-
10
-
11
-
12
-
13
-
14
-
15
-
16
-
17
-
18
-
19
-
20
-
21
-
22
-
23
-
24
-
25
-
26
-
27
-
28
-
29
-
30
-
31
-
32
-
33
-
34
-
35
-
36
-
37
-
38
-
39
-
40
-
41
-
42
-
 43
43 -
 44
44 -
 45
45 -
 46
46 -
 47
47 -
 48
48 -
 49
49 -
 50
50 -
 51
51 -
 52
52 -
 53
53 -
 54
54 -
 55
55 -
 56
56 -
 57
57 -
 58
58 -
 59
59 -
 60
60 -
 61
61 -
 62
62 -
 63
63 -
64
-
65
-
66
-
67
-
68
-
69
-
70
-
71
-
72
-
73
-
74
-
75
-
76
-
77
-
78
-
79
-
80
-
81
-
82
-
83
-
84
-
85
-
86
-
87
-
88
-
89
-
90
-
91
-
92
-
93
-
94
-
95
-
96
-
97
-
98
-
99
-
100
-
101
-
102
-
103
-
104
-
105
-
106
-
107
-
108
-
109
-
110
-
111
-
112
 |
 |

ANNUAL REPORT 2014
51
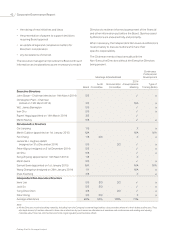
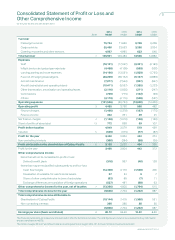
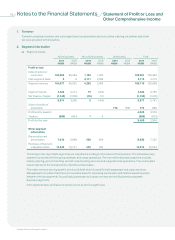
Consolidated Statement of Profit or Loss and
Other Comprehensive Income
for the year ended 31st December 2014
Note
2014
HK$M
2013
HK$M
2014
US$M
2013
US$M
Turnover
Passenger services 75,734 71,826 9,709 9,208
Cargo services 25,400 23,663 3,256 3,034
Catering, recoveries and other services 4,857 4,995 623 640
Total turnover 1105,991 100,484 13,588 12,882
Expenses
Staff (18,101) (17,027) (2,321) (2,183)
Inflight service and passenger expenses (4,438) (4,138) (569) (530)
Landing, parking and route expenses (14,196) (13,531) (1,820) (1,735)
Fuel, net of hedging (losses)/gains (40,299) (38,132) (5,167) (4,889)
Aircraft maintenance (7,077) (7,542) (907) (967)
Aircraft depreciation and operating leases (10,411) (9,537) (1,335) (1,223)
Other depreciation, amortisation and operating leases (2,116) (1,926) (271) (247)
Commissions (799) (775) (102) (99)
Others (4,119) (4,116) (528) (527)
Operating expenses (101,556) (96,724) (13,020) (12,400)
Operating profit 34,435 3,760 568 482
Finance charges (1,460) (1,370) (187) (175)
Finance income 302 351 39 45
Net finance charges 4(1,158) (1,019) (148) (130)
Share of profits of associates 13 772 838 99 107
Profit before taxation 4,049 3,579 519 459
Taxation 5(599) (675) (77) (87)
Profit for the year 3,450 2,904 442 372
Non-controlling interests (300) (284) (38) (36)
Profit attributable to the shareholders of Cathay Pacific 63,150 2,620 404 336
Profit for the year 3,450 2,904 442 372
Other comprehensive income
Items that will not be reclassified to profit or loss:
Defined benefit plans (316) 997 (40) 128
Items that may be reclassified subsequently to profit or loss:
Cash flow hedges (12,468) 3,170 (1,598) 406
Revaluation of available-for-sale financial assets 67 53 97
Share of other comprehensive income of associates (52) 89 (7) 11
Exchange differences on translation of foreign operations (527) 491 (68) 63
Other comprehensive income for the year, net of taxation 7(13,296) 4,800 (1,704) 615
Total comprehensive income for the year (9,846) 7,704 (1,262) 987
Total comprehensive income attributable to
Shareholders of Cathay Pacific (10,144) 7,418 (1,300) 951
Non-controlling interests 298 286 38 36
(9,846) 7,704 (1,262) 987
Earnings per share (basic and diluted) 8 80.1¢ 66.6¢ 10.3¢ 8.5¢
The financial statements are prepared and presented in HK$, the functional currency. The US$ figures are shown only as supplementary information
and are translated at HK$7.8.
The notes on pages 56 to 97 and the principal accounting policies on pages 98 to 101 form part of these financial statements.