General Motors 2011 Annual Report Download - page 118
Download and view the complete annual report
Please find page 118 of the 2011 General Motors annual report below. You can navigate through the pages in the report by either clicking on the pages listed below, or by using the keyword search tool below to find specific information within the annual report.-
 1
1 -
2
-
3
-
4
-
5
-
6
-
7
-
8
-
9
-
10
-
11
-
12
-
13
-
14
-
15
-
16
-
17
-
18
-
19
-
20
-
21
-
22
-
23
-
24
-
25
-
26
-
27
-
28
-
29
-
30
-
31
-
32
-
33
-
34
-
35
-
36
-
37
-
38
-
39
-
40
-
41
-
42
-
43
-
44
-
45
-
46
-
47
-
48
-
49
-
50
-
51
-
52
-
53
-
54
-
55
-
56
-
57
-
58
-
59
-
60
-
61
-
62
-
63
-
64
-
65
-
66
-
67
-
68
-
69
-
70
-
71
-
72
-
73
-
74
-
75
-
76
-
77
-
78
-
79
-
80
-
81
-
82
-
83
-
84
-
85
-
86
-
87
-
88
-
89
-
90
-
91
-
92
-
93
-
94
-
95
-
96
-
97
-
98
-
99
-
100
-
101
-
102
-
103
-
104
-
105
-
106
-
107
-
 108
108 -
 109
109 -
 110
110 -
 111
111 -
 112
112 -
 113
113 -
 114
114 -
 115
115 -
 116
116 -
 117
117 -
 118
118 -
 119
119 -
 120
120 -
 121
121 -
 122
122 -
 123
123 -
 124
124 -
 125
125 -
 126
126 -
 127
127 -
 128
128 -
129
-
130
-
131
-
132
-
133
-
134
-
135
-
136
-
137
-
138
-
139
-
140
-
141
-
142
-
143
-
144
-
145
-
146
-
147
-
148
-
149
-
150
-
151
-
152
-
153
-
154
-
155
-
156
-
157
-
158
-
159
-
160
-
161
-
162
-
163
-
164
-
165
-
166
-
167
-
168
-
169
-
170
-
171
-
172
-
173
-
174
-
175
-
176
-
177
-
178
-
179
-
180
-
181
-
182
-
183
-
184
-
185
-
186
-
187
-
188
-
189
-
190
-
191
-
192
-
193
-
194
-
195
-
196
-
197
-
198
-
199
-
200
 |
 |

GENERAL MOTORS COMPANY AND SUBSIDIARIES
NOTES TO CONSOLIDATED FINANCIAL STATEMENTS — (Continued)
(c) GME amounts at January 1, 2011 and March 31, 2011 are 2011 through 2015 and GME amounts at December 31, 2011 are 2012
through 2016. All others amounts are 2012 through 2015.
During our Step 2 analyses we determined the fair values of these reporting units had not increased sufficiently to give rise to
implied goodwill other than the goodwill arising from the fair value-to-U.S. GAAP differences attributable to those assets and
liabilities that gave rise to goodwill upon application of fresh-start reporting. On certain of our testing dates our Step 2 analyses
indicated GME’s, GM Korea’s and Holden’s implied goodwill was less than their recorded goodwill; therefore, goodwill was adjusted
at various dates in the year ended December 31, 2011.
Future goodwill impairments that may be material could be recognized should the recent economic uncertainty continue, our equity
price decline on a sustained basis, global economies enter into another recession and industry growth stagnates, or should we release
deferred tax asset valuation allowances in certain tax jurisdictions (which could occur in the near future if additional positive evidence
becomes available).
In these circumstances future goodwill impairments would largely be affected by decreases in the fair value-to-U.S.-GAAP
differences that have occurred subsequent to our application of fresh-start reporting. The decrease may occur upon; (1) an
improvement in our credit rating; (2) a decrease in credit spreads between high quality corporate bond rates and market interest rates
thus resulting in a decrease in the spread between our employee benefit related obligations under U.S. GAAP and their fair values;
and/or (3) a change in the fair values of our estimated employee benefit obligations. A decrease would also occur upon reversal of our
deferred tax asset valuation allowances. Any declines would have a negative effect on our earnings that could be material.
Our fair value estimates for annual and event-driven impairment tests assume the achievement of the future financial results
contemplated in our forecasted cash flows and there can be no assurance that we will realize that value. The estimates and
assumptions used are subject to significant uncertainties, many of which are beyond our control, and there is no assurance that
anticipated financial results will be achieved.
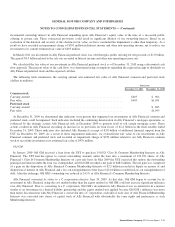
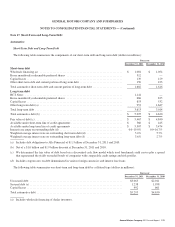
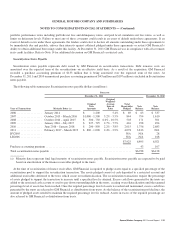
Note 13. Intangible Assets, net
Automotive
The following table summarizes the components of Intangible assets, net (dollars in millions):
Successor
December 31, 2011 December 31, 2010
Weighted-
Average
Remaining
Amortization
Period
(Years)
Gross
Carrying
Amount
Accumulated
Amortization
Net
Carrying
Amount
Weighted-
Average
Remaining
Amortization
Period
(Years)
Gross
Carrying
Amount
Accumulated
Amortization
Net
Carrying
Amount
Technology and intellectual property ......... 3 $ 7,749 $5,080 $ 2,669 3 $ 7,751 $3,650 $ 4,101
Brands . . . . . . . . . . . . . . . . . . . . . . . . . . . . . . . . . 36 5,408 372 5,036 37 5,439 222 5,217
Dealer network and customer relationships . . . . 20 2,134 318 1,816 20 2,172 199 1,973
Favorable contracts . . . . . . . . . . . . . . . . . . . . . . . 30 514 200 314 26 526 120 406
Other .................................. 1 17 14 3 2 19 9 10
Total amortizing intangible assets . . . . . . . . . . . 24 15,822 5,984 9,838 21 15,907 4,200 11,707
Non amortizing in process research and
development . . . . . . . . . . . . . . . . . . . . . . . . . . 175 — 175 175 — 175
Total intangible assets ..................... $15,997 $5,984 $10,013 $16,082 $4,200 $11,882
116 General Motors Company 2011 Annual Report