General Motors 2011 Annual Report Download - page 185
Download and view the complete annual report
Please find page 185 of the 2011 General Motors annual report below. You can navigate through the pages in the report by either clicking on the pages listed below, or by using the keyword search tool below to find specific information within the annual report.-
 1
1 -
2
-
3
-
4
-
5
-
6
-
7
-
8
-
9
-
10
-
11
-
12
-
13
-
14
-
15
-
16
-
17
-
18
-
19
-
20
-
21
-
22
-
23
-
24
-
25
-
26
-
27
-
28
-
29
-
30
-
31
-
32
-
33
-
34
-
35
-
36
-
37
-
38
-
39
-
40
-
41
-
42
-
43
-
44
-
45
-
46
-
47
-
48
-
49
-
50
-
51
-
52
-
53
-
54
-
55
-
56
-
57
-
58
-
59
-
60
-
61
-
62
-
63
-
64
-
65
-
66
-
67
-
68
-
69
-
70
-
71
-
72
-
73
-
74
-
75
-
76
-
77
-
78
-
79
-
80
-
81
-
82
-
83
-
84
-
85
-
86
-
87
-
88
-
89
-
90
-
91
-
92
-
93
-
94
-
95
-
96
-
97
-
98
-
99
-
100
-
101
-
102
-
103
-
104
-
105
-
106
-
107
-
108
-
109
-
110
-
111
-
112
-
113
-
114
-
115
-
116
-
117
-
118
-
119
-
120
-
121
-
122
-
123
-
124
-
125
-
126
-
127
-
128
-
129
-
130
-
131
-
132
-
133
-
134
-
135
-
136
-
137
-
138
-
139
-
140
-
141
-
142
-
143
-
144
-
145
-
146
-
147
-
148
-
149
-
150
-
151
-
152
-
153
-
154
-
155
-
156
-
157
-
158
-
159
-
160
-
161
-
162
-
163
-
164
-
165
-
166
-
167
-
168
-
169
-
170
-
171
-
172
-
173
-
174
-
 175
175 -
 176
176 -
 177
177 -
 178
178 -
 179
179 -
 180
180 -
 181
181 -
 182
182 -
 183
183 -
 184
184 -
 185
185 -
 186
186 -
 187
187 -
 188
188 -
 189
189 -
 190
190 -
 191
191 -
 192
192 -
 193
193 -
 194
194 -
 195
195 -
196
-
197
-
198
-
199
-
200
 |
 |

GENERAL MOTORS COMPANY AND SUBSIDIARIES
NOTES TO CONSOLIDATED FINANCIAL STATEMENTS — (Continued)
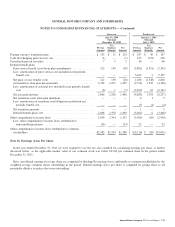
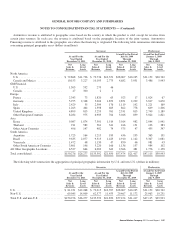
The following tables summarize key financial information by segment (dollars in millions):
Successor
GMNA GME GMIO GMSA Corporate Eliminations
Total
Automotive
GM
Financial Eliminations Total
At and For the Year Ended
December 31, 2011
Sales
External customers .................... $85,988 $25,154 $21,031 $16,632 $ 61 $ — $148,866 $ — $ — $148,866
GM Financial revenue .................———— — — —1,410 — 1,410
Intersegment ......................... 4,245 1,603 3,730 245 — (9,820) 3 — (3) —
Total net sales and revenue ................ $90,233 $26,757 $24,761 $16,877 $ 61 $ (9,820) $148,869 $ 1,410 $ (3) $150,276
Income (loss) before automotive interest and
income taxes-adjusted .................. $ 7,194 $ (747) $ 1,897 $ (122) $ (447) $ (93) $ 7,682 $ 622 $ — $ 8,304
Adjustments (a) ......................... 861
Corporate interest income ................. 455
Automotive interest expense ............... 540
Income (loss) before income taxes .......... 9,080
Income tax expense (benefit) .............. (110)
Net income attributable to stockholders ...... $ 9,190
Equity in net assets of nonconsolidated
affiliates . . . . . . . . . . . . . . . . . . . . . . . . . . . . $ 60 $ 50 $ 6,678 $ 2 $ — $ — $ 6,790 $ — $ — $ 6,790
Total assets ............................ $83,595 $15,799 $22,181 $11,631 $30,244 $(31,590) $131,860 $13,112 $(369) $144,603
Expenditures for property ................. $ 3,404 $ 1,016 $ 907 $ 880 $ 44 $ (10) $ 6,241 $ 8 $ — $ 6,249
Depreciation, amortization and impairment of
long-lived assets and finite-lived intangible
assets ............................... $ 3,693 $ 1,371 $ 491 $ 454 $ 50 $ (1) $ 6,058 $ 85 $ (2) $ 6,141
Equity income, net of tax and gain on disposal
of investments (b) ..................... $ 1,733 $ — $ 1,458 $ 1 $ — $ — $ 3,192 $ — $ — $ 3,192
Significant non-cash charges (gains) not
classified as adjustments in (a)
Impairment charges related to long-lived
assets . . . . . . . . . . . . . . . . . . . . . . . . . . . . . $ 74 $ — $ 4 $ 3 $ — $ — $ 81 $ — $ — $ 81
Impairment charges related to equipment on
operating leases . . . . . . . . . . . . . . . . . . . . . 75 76 — — — — 151 — — 151
Reversal of valuation allowances against
deferred tax assets (c) ................————(488) — (488) — — (488)
Total significant non-cash charges (gains) . . . . $ 149 $ 76 $ 4 $ 3 $ (488) $ — $ (256) $ — $ — $ (256)
(a) Consists of the gain on sale of our New Delphi Class A Membership Interests of $1.6 billion and the gain related to the HCT settlement of $749 million in GMNA,
Goodwill impairment charges of $1.0 billion in GME, Goodwill impairment charges of $258 million and charges related to HKJV of $106 million in GMIO, a gain
on extinguishment of debt of $63 million in GMSA and impairment charges of $555 million related to Ally Financial common stock and a gain on the sale of Ally
Financial preferred stock of $339 million in Corporate.
(b) Includes a gain of $1.6 billion recorded on the sale of our New Delphi Class A Membership Interests. Refer to Note 10 for additional information on the sale of
New Delphi.
(c) Amounts exclude changes related to income tax expense (benefits) in jurisdictions with a full valuation allowance throughout the period.
General Motors Company 2011 Annual Report 183