HSBC 2002 Annual Report Download - page 262
Download and view the complete annual report
Please find page 262 of the 2002 HSBC annual report below. You can navigate through the pages in the report by either clicking on the pages listed below, or by using the keyword search tool below to find specific information within the annual report.-
 1
1 -
2
-
3
-
4
-
5
-
6
-
7
-
8
-
9
-
10
-
11
-
12
-
13
-
14
-
15
-
16
-
17
-
18
-
19
-
20
-
21
-
22
-
23
-
24
-
25
-
26
-
27
-
28
-
29
-
30
-
31
-
32
-
33
-
34
-
35
-
36
-
37
-
38
-
39
-
40
-
41
-
42
-
43
-
44
-
45
-
46
-
47
-
48
-
49
-
50
-
51
-
52
-
53
-
54
-
55
-
56
-
57
-
58
-
59
-
60
-
61
-
62
-
63
-
64
-
65
-
66
-
67
-
68
-
69
-
70
-
71
-
72
-
73
-
74
-
75
-
76
-
77
-
78
-
79
-
80
-
81
-
82
-
83
-
84
-
85
-
86
-
87
-
88
-
89
-
90
-
91
-
92
-
93
-
94
-
95
-
96
-
97
-
98
-
99
-
100
-
101
-
102
-
103
-
104
-
105
-
106
-
107
-
108
-
109
-
110
-
111
-
112
-
113
-
114
-
115
-
116
-
117
-
118
-
119
-
120
-
121
-
122
-
123
-
124
-
125
-
126
-
127
-
128
-
129
-
130
-
131
-
132
-
133
-
134
-
135
-
136
-
137
-
138
-
139
-
140
-
141
-
142
-
143
-
144
-
145
-
146
-
147
-
148
-
149
-
150
-
151
-
152
-
153
-
154
-
155
-
156
-
157
-
158
-
159
-
160
-
161
-
162
-
163
-
164
-
165
-
166
-
167
-
168
-
169
-
170
-
171
-
172
-
173
-
174
-
175
-
176
-
177
-
178
-
179
-
180
-
181
-
182
-
183
-
184
-
185
-
186
-
187
-
188
-
189
-
190
-
191
-
192
-
193
-
194
-
195
-
196
-
197
-
198
-
199
-
200
-
201
-
202
-
203
-
204
-
205
-
206
-
207
-
208
-
209
-
210
-
211
-
212
-
213
-
214
-
215
-
216
-
217
-
218
-
219
-
220
-
221
-
222
-
223
-
224
-
225
-
226
-
227
-
228
-
229
-
230
-
231
-
232
-
233
-
234
-
235
-
236
-
237
-
238
-
239
-
240
-
241
-
242
-
243
-
244
-
245
-
246
-
247
-
248
-
249
-
250
-
251
-
 252
252 -
 253
253 -
 254
254 -
 255
255 -
 256
256 -
 257
257 -
 258
258 -
 259
259 -
 260
260 -
 261
261 -
 262
262 -
 263
263 -
 264
264 -
 265
265 -
 266
266 -
 267
267 -
 268
268 -
 269
269 -
 270
270 -
 271
271 -
 272
272 -
273
-
274
-
275
-
276
-
277
-
278
-
279
-
280
-
281
-
282
-
283
-
284
-
285
-
286
-
287
-
288
-
289
-
290
-
291
-
292
-
293
-
294
-
295
-
296
-
297
-
298
-
299
-
300
-
301
-
302
-
303
-
304
-
305
-
306
-
307
-
308
-
309
-
310
-
311
-
312
-
313
-
314
-
315
-
316
-
317
-
318
-
319
-
320
-
321
-
322
-
323
-
324
-
325
-
326
-
327
-
328
-
329
 |
 |

HSBC HOLDINGS PLC
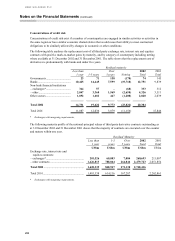
Notes on the Financial Statements (continued)
260
2002 2001
Contrac
t
amoun
t
R
eplacemen
t
cos
t
*
Contrac
t
amoun
t
R
eplacemen
t
cos
t
*
US$m US$m US$m US$m
Spot and forward foreign exchange ........... 668,784 11,096 685,674 7,770
Currency swaps, futures and options
purchased ............................................... 183,070 3,927 127,120 3,045
Currency options written ........................... 57,300
–
36,087
–
Other contracts........................................... 24,901 404 7,530 104
Total exchange rate contracts..................... 934,055 15,427 856,411 10,919
Interest rate swaps...................................... 1,381,970 23,442 1,013,807 12,703
Interest rate futures, forward rate
agreements, collars and options
purchased ............................................... 431,777 2,316 408,758 1,261
Interest rate options written ....................... 151,420
–
87,245
–
Total interest rate contracts........................ 1,965,167 25,758 1,509,810 13,964
Equities, futures and options purchased..... 24,582 1,593 18,583 1,309
Equities options written ............................. 18,762
–
16,235
–
Other contracts........................................... 5,250 329 5,442 197
Total equities contracts .............................. 48,594 1,922 40,260 1,506
Netting ....................................................... (23,822) (11,156)
Total........................................................... 2,947,816 19,285 2,406,481 15,233
* Third party contracts only
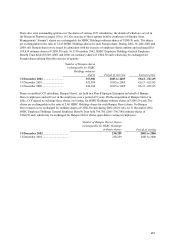
Included in the above table are third party credit derivatives with a contract amount of US$17,405 million
(2001: US$2,171 million) and a replacement cost of US$272 million (2001: US$18 million). These amounts
represent mainly credit default protection products bought or sold.
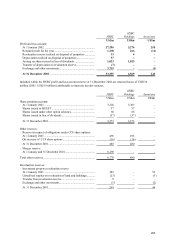
2002 2001
Mark-to-
market values
at year en
d
Average
mark-to-
market values
for the year
Mark-to-
market values
at year en
d
Average
Mark-to-
Market values
for the year
US$m US$m US$m US$m
Exchange rate assets.......................... 16,866 13,348 11,182 11,933
liabilities .................... (17,263) (13,656)(11,113) (12,298)
Interest rate assets.......................... 26,197 18,560 14,043 12,790
liabilities .................... (26,873) (18,173)(13,572) (12,547)
Equities assets.......................... 1,923 1,836 1,506 1,737
liabilities .................... (1,993) (2,354)(1,871) (1,813)
Total assets.......................... 44,986 33,744 26,731 26,460
liabilities .................... (46,129) (34,183) (26,556) (26,658)
Netting ....................................................... 23,822 15,073 11,156 9,977
The above amounts are stated after deducting cash collateral meeting the offset criteria of FRS5 as follows:
Offset against assets .................................. 1,992 367
Offset against liabilities ............................. 327 108