HSBC 2002 Annual Report Download - page 84
Download and view the complete annual report
Please find page 84 of the 2002 HSBC annual report below. You can navigate through the pages in the report by either clicking on the pages listed below, or by using the keyword search tool below to find specific information within the annual report.-
 1
1 -
2
-
3
-
4
-
5
-
6
-
7
-
8
-
9
-
10
-
11
-
12
-
13
-
14
-
15
-
16
-
17
-
18
-
19
-
20
-
21
-
22
-
23
-
24
-
25
-
26
-
27
-
28
-
29
-
30
-
31
-
32
-
33
-
34
-
35
-
36
-
37
-
38
-
39
-
40
-
41
-
42
-
43
-
44
-
45
-
46
-
47
-
48
-
49
-
50
-
51
-
52
-
53
-
54
-
55
-
56
-
57
-
58
-
59
-
60
-
61
-
62
-
63
-
64
-
65
-
66
-
67
-
68
-
69
-
70
-
71
-
72
-
73
-
 74
74 -
 75
75 -
 76
76 -
 77
77 -
 78
78 -
 79
79 -
 80
80 -
 81
81 -
 82
82 -
 83
83 -
 84
84 -
 85
85 -
 86
86 -
 87
87 -
 88
88 -
 89
89 -
 90
90 -
 91
91 -
 92
92 -
 93
93 -
 94
94 -
95
-
96
-
97
-
98
-
99
-
100
-
101
-
102
-
103
-
104
-
105
-
106
-
107
-
108
-
109
-
110
-
111
-
112
-
113
-
114
-
115
-
116
-
117
-
118
-
119
-
120
-
121
-
122
-
123
-
124
-
125
-
126
-
127
-
128
-
129
-
130
-
131
-
132
-
133
-
134
-
135
-
136
-
137
-
138
-
139
-
140
-
141
-
142
-
143
-
144
-
145
-
146
-
147
-
148
-
149
-
150
-
151
-
152
-
153
-
154
-
155
-
156
-
157
-
158
-
159
-
160
-
161
-
162
-
163
-
164
-
165
-
166
-
167
-
168
-
169
-
170
-
171
-
172
-
173
-
174
-
175
-
176
-
177
-
178
-
179
-
180
-
181
-
182
-
183
-
184
-
185
-
186
-
187
-
188
-
189
-
190
-
191
-
192
-
193
-
194
-
195
-
196
-
197
-
198
-
199
-
200
-
201
-
202
-
203
-
204
-
205
-
206
-
207
-
208
-
209
-
210
-
211
-
212
-
213
-
214
-
215
-
216
-
217
-
218
-
219
-
220
-
221
-
222
-
223
-
224
-
225
-
226
-
227
-
228
-
229
-
230
-
231
-
232
-
233
-
234
-
235
-
236
-
237
-
238
-
239
-
240
-
241
-
242
-
243
-
244
-
245
-
246
-
247
-
248
-
249
-
250
-
251
-
252
-
253
-
254
-
255
-
256
-
257
-
258
-
259
-
260
-
261
-
262
-
263
-
264
-
265
-
266
-
267
-
268
-
269
-
270
-
271
-
272
-
273
-
274
-
275
-
276
-
277
-
278
-
279
-
280
-
281
-
282
-
283
-
284
-
285
-
286
-
287
-
288
-
289
-
290
-
291
-
292
-
293
-
294
-
295
-
296
-
297
-
298
-
299
-
300
-
301
-
302
-
303
-
304
-
305
-
306
-
307
-
308
-
309
-
310
-
311
-
312
-
313
-
314
-
315
-
316
-
317
-
318
-
319
-
320
-
321
-
322
-
323
-
324
-
325
-
326
-
327
-
328
-
329
 |
 |

HSBC HOLDINGS PLC
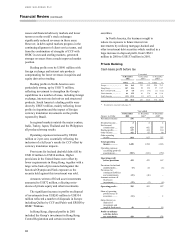
Financial Review (continued)
82
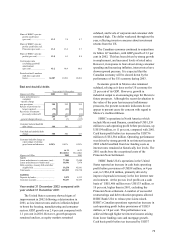
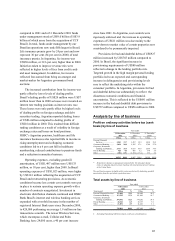
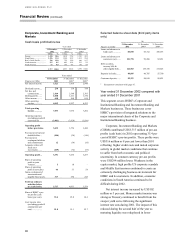
Net assets by line of business
Year ended
31 December
2002
31 December
2001
US$m % US$m %
Personal Financial Services . 12,101 23.0 9,309 20.1
Commercial Banking........... 10,290 19.6 9,108 19.6
Corporate, Investment
Banking and Markets..... 16,852 32.2 15,046 32.4
Private Banking................... 7,366 14.1 6,195 13.4
Other ................................. 5,797 11.1 6,730 14.5
52,406 100.0 46,388 100.0
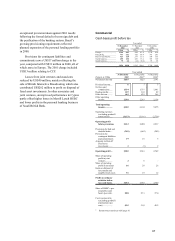
The data presented on pages 83 to 96 reflects an
analysis of HSBC’s results and of certain key
balance sheet amounts, according to the lines of
business described on pages 12 to 14. This
provides additional and complementary analysis to
HSBC’s segmental reporting by geographic region.
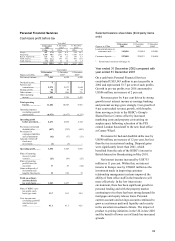
The figures for 2001 and 2000 have been
restated where changes in management
responsibility for the business this year impact on
comparatives. The principal change relates to
aligning domestic private banking with
international private banking in the United States
and therefore moving the results from Personal
Financial Services into Private Banking. Total
assets and net assets split by line of business are
disclosed for the first time with 2001 comparatives.
Year 2000 comparatives are not available.
The results are presented in accordance with
the accounting policies used in the preparation of
HSBC’s consolidated financial statements. HSBC’s
operations are closely integrated and, accordingly,
the presentation of line of business data includes
internal allocations of certain items of income and
expense. These allocations include the costs of
certain support services and head office functions,
to the extent that these can be meaningfully
attributed to operational business lines. While such
allocations have been made on a systematic and
consistent basis they necessarily involve a degree
of subjectivity.
Where relevant, income and expense amounts
presented include the results of inter-company and
inter-business line transactions. Such transactions
are undertaken on arm’s-length terms. Intra-
segment funding and placement of surplus funds is
generally undertaken at market interest rates.
The reported results of each line of business
include the funding benefit of shareholders’ funds
allocated to that business. Shareholders’ funds are
generally allocated to lines of business on the basis
of economic capital measures including the relative
risk-weighted assets of each operation.
In the analysis of profit by line of business,
total operating income and operating expenses
include intra-HSBC items of US$1,148 million,
US$1,057 million in 2001 and US$931 million in
2000.
All commentary is made on a cash basis, that
is excluding the impact of goodwill amortisation.