HSBC 2007 Annual Report Download - page 222
Download and view the complete annual report
Please find page 222 of the 2007 HSBC annual report below. You can navigate through the pages in the report by either clicking on the pages listed below, or by using the keyword search tool below to find specific information within the annual report.-
 1
1 -
2
-
3
-
4
-
5
-
6
-
7
-
8
-
9
-
10
-
11
-
12
-
13
-
14
-
15
-
16
-
17
-
18
-
19
-
20
-
21
-
22
-
23
-
24
-
25
-
26
-
27
-
28
-
29
-
30
-
31
-
32
-
33
-
34
-
35
-
36
-
37
-
38
-
39
-
40
-
41
-
42
-
43
-
44
-
45
-
46
-
47
-
48
-
49
-
50
-
51
-
52
-
53
-
54
-
55
-
56
-
57
-
58
-
59
-
60
-
61
-
62
-
63
-
64
-
65
-
66
-
67
-
68
-
69
-
70
-
71
-
72
-
73
-
74
-
75
-
76
-
77
-
78
-
79
-
80
-
81
-
82
-
83
-
84
-
85
-
86
-
87
-
88
-
89
-
90
-
91
-
92
-
93
-
94
-
95
-
96
-
97
-
98
-
99
-
100
-
101
-
102
-
103
-
104
-
105
-
106
-
107
-
108
-
109
-
110
-
111
-
112
-
113
-
114
-
115
-
116
-
117
-
118
-
119
-
120
-
121
-
122
-
123
-
124
-
125
-
126
-
127
-
128
-
129
-
130
-
131
-
132
-
133
-
134
-
135
-
136
-
137
-
138
-
139
-
140
-
141
-
142
-
143
-
144
-
145
-
146
-
147
-
148
-
149
-
150
-
151
-
152
-
153
-
154
-
155
-
156
-
157
-
158
-
159
-
160
-
161
-
162
-
163
-
164
-
165
-
166
-
167
-
168
-
169
-
170
-
171
-
172
-
173
-
174
-
175
-
176
-
177
-
178
-
179
-
180
-
181
-
182
-
183
-
184
-
185
-
186
-
187
-
188
-
189
-
190
-
191
-
192
-
193
-
194
-
195
-
196
-
197
-
198
-
199
-
200
-
201
-
202
-
203
-
204
-
205
-
206
-
207
-
208
-
209
-
210
-
211
-
 212
212 -
 213
213 -
 214
214 -
 215
215 -
 216
216 -
 217
217 -
 218
218 -
 219
219 -
 220
220 -
 221
221 -
 222
222 -
 223
223 -
 224
224 -
 225
225 -
 226
226 -
 227
227 -
 228
228 -
 229
229 -
 230
230 -
 231
231 -
 232
232 -
233
-
234
-
235
-
236
-
237
-
238
-
239
-
240
-
241
-
242
-
243
-
244
-
245
-
246
-
247
-
248
-
249
-
250
-
251
-
252
-
253
-
254
-
255
-
256
-
257
-
258
-
259
-
260
-
261
-
262
-
263
-
264
-
265
-
266
-
267
-
268
-
269
-
270
-
271
-
272
-
273
-
274
-
275
-
276
-
277
-
278
-
279
-
280
-
281
-
282
-
283
-
284
-
285
-
286
-
287
-
288
-
289
-
290
-
291
-
292
-
293
-
294
-
295
-
296
-
297
-
298
-
299
-
300
-
301
-
302
-
303
-
304
-
305
-
306
-
307
-
308
-
309
-
310
-
311
-
312
-
313
-
314
-
315
-
316
-
317
-
318
-
319
-
320
-
321
-
322
-
323
-
324
-
325
-
326
-
327
-
328
-
329
-
330
-
331
-
332
-
333
-
334
-
335
-
336
-
337
-
338
-
339
-
340
-
341
-
342
-
343
-
344
-
345
-
346
-
347
-
348
-
349
-
350
-
351
-
352
-
353
-
354
-
355
-
356
-
357
-
358
-
359
-
360
-
361
-
362
-
363
-
364
-
365
-
366
-
367
-
368
-
369
-
370
-
371
-
372
-
373
-
374
-
375
-
376
-
377
-
378
-
379
-
380
-
381
-
382
-
383
-
384
-
385
-
386
-
387
-
388
-
389
-
390
-
391
-
392
-
393
-
394
-
395
-
396
-
397
-
398
-
399
-
400
-
401
-
402
-
403
-
404
-
405
-
406
-
407
-
408
-
409
-
410
-
411
-
412
-
413
-
414
-
415
-
416
-
417
-
418
-
419
-
420
-
421
-
422
-
423
-
424
-
425
-
426
-
427
-
428
-
429
-
430
-
431
-
432
-
433
-
434
-
435
-
436
-
437
-
438
-
439
-
440
-
441
-
442
-
443
-
444
-
445
-
446
-
447
-
448
-
449
-
450
-
451
-
452
-
453
-
454
-
455
-
456
-
457
-
458
-
459
-
460
-
461
-
462
-
463
-
464
-
465
-
466
-
467
-
468
-
469
-
470
-
471
-
472
-
473
-
474
-
475
-
476
 |
 |

HSBC HOLDINGS PLC
Report of the Directors: The Management of Risk (continued)
Credit risk > Areas of special interest > US personal lending / Loan delinquency in US
220
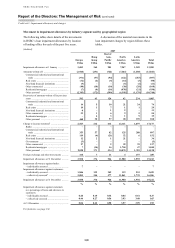
HSBC Finance: geographical concentration of US lending1
(Unaudited)
Mortgage lending as a
percentage of:
Other personal lending as a
percentage of
total
lending
total
mortgage
lending
total
lending
total other
personal
lending
Percentage
of total
lending
% % % % %
California ............................................................................... 6 12 6 12 12
Florida .................................................................................... 4 7 3 7 7
New York ............................................................................... 3 6 3 6 6
Texas ...................................................................................... 2 3 4 8 6
Ohio ....................................................................................... 3 5 2 5 5
Pennsylvania .......................................................................... 3 5 2 5 5
1 By states which individually account for 5 per cent or more of HSBC Finance’s US customer loan portfolio.
purchase of the property. For second lien
mortgages, the proportion of customers two months
or more behind on contractual payments rose from
3.97 per cent at 31 December 2006 to 9.02 per cent
at the end of 2007. Loss on default of second lien
loans approaches 100 per cent of the amount owed
as any collateral in the property is applied initially
to the first lien loan.
Stated-income mortgages are also of above
average risk as these were underwritten on the basis
of borrowers’ representations of annual income, not
verified by receipt of supporting documentation. In
HSBC Finance mortgage services, two months or
more delinquency rates on stated-income loans rose
from 6.36 per cent at 31 December 2006 to
19.01 per cent at 31 December 2007. In part, the
percentage rise is due to a decline in loan balances
as the mortgage loan portfolio is run off.
In mortgage services, the deterioration in credit
performance first reported in 2006 continued. In
the second half of 2007, credit quality became
progressively worse due to the market conditions
discussed above. Two months or more
delinquencies increased from US$2.3 billion,
4.64 per cent of loans and advances at the end
of 2006, to US$4.1 billion, 11.24 per cent at
31 December 2007. The increase in the
delinquency rate was partly due to the reduction
in the size of the portfolio.
In response, HSBC took several management
actions to reposition the US consumer business.
In March 2007, it took the decision to cease
purchasing mortgages from third party
correspondents. In September 2007, the Group
closed its wholesale business, Decision One,
ending new originations for the mortgage
services business.
The branch-based consumer lending business
experienced relatively stable performance in its
portfolio throughout 2006 and into the first half of
2007. Starting in the fourth quarter of 2006,
delinquencies began to rise in loans of 2005 and
later vintages, to levels above what had been
previously experienced. This trend was also seen in
the rest of the industry. It is clear that, for some
time, equity withdrawal has been the principal
source of credit available to sub-prime borrowers
dealing with unforeseen financial needs. Declining
house prices and an industry-wide tightening of
underwriting criteria have significantly reduced the
ability of consumers to refinance. Starting from the
third quarter, these factors had a marked effect on
consumer lending delinquency. Two months or
more delinquencies rose from 2.22 per cent at
31 December 2006 to 4.18 per cent of loans and
advances at the end of 2007. Delinquent balances
doubled to US$2.1 billion. In this environment,
HSBC took steps to tighten underwriting standards,
including decreasing the loan to value ratio for
residential mortgages and ceasing to underwrite
certain products. To match the consequent
reduction in demand and risk appetite, the network
was reduced from nearly 1,400 branches to some
1,000.
HSBC also sold parts of the loan portfolio
when opportunities arose at suitable valuations. In
the first half of 2007, a total of US$2.7 billion of
mortgage services’ loans that did not include any
loans 30 days or more delinquent were sold.
Credit card delinquencies of two months or
more rose from 4.48 per cent at the end of 2006 to
5.68 per cent of receivables at 31 December 2007.
In part, this was due to a change in product mix, as
originations in the sub-prime and near-prime parts
of the portfolio grew at faster rates than the overall
portfolio. There was also an increase in bankruptcy
rates as levels moved closer to historical norms
following the exceptionally low level of filings
seen during 2006. Additionally, in the fourth
quarter of 2007, delinquencies began to rise in all
vintages, particularly in the markets experiencing