Medtronic 2016 Annual Report Download - page 119
Download and view the complete annual report
Please find page 119 of the 2016 Medtronic annual report below. You can navigate through the pages in the report by either clicking on the pages listed below, or by using the keyword search tool below to find specific information within the annual report.-
 1
1 -
2
-
3
-
4
-
5
-
6
-
7
-
8
-
9
-
10
-
11
-
12
-
13
-
14
-
15
-
16
-
17
-
18
-
19
-
20
-
21
-
22
-
23
-
24
-
25
-
26
-
27
-
28
-
29
-
30
-
31
-
32
-
33
-
34
-
35
-
36
-
37
-
38
-
39
-
40
-
41
-
42
-
43
-
44
-
45
-
46
-
47
-
48
-
49
-
50
-
51
-
52
-
53
-
54
-
55
-
56
-
57
-
58
-
59
-
60
-
61
-
62
-
63
-
64
-
65
-
66
-
67
-
68
-
69
-
70
-
71
-
72
-
73
-
74
-
75
-
76
-
77
-
78
-
79
-
80
-
81
-
82
-
83
-
84
-
85
-
86
-
87
-
88
-
89
-
90
-
91
-
92
-
93
-
94
-
95
-
96
-
97
-
98
-
99
-
100
-
101
-
102
-
103
-
104
-
105
-
106
-
107
-
108
-
 109
109 -
 110
110 -
 111
111 -
 112
112 -
 113
113 -
 114
114 -
 115
115 -
 116
116 -
 117
117 -
 118
118 -
 119
119 -
 120
120 -
 121
121 -
 122
122 -
 123
123 -
 124
124 -
 125
125 -
 126
126 -
 127
127 -
 128
128 -
 129
129 -
130
-
131
-
132
-
133
-
134
-
135
-
136
-
137
-
138
-
139
-
140
-
141
-
142
-
143
-
144
-
145
-
146
-
147
-
148
-
149
-
150
-
151
-
152
-
153
-
154
-
155
-
156
-
157
-
158
 |
 |

Table of Contents
Medtronic plc
Notes to Consolidated Financial Statements (Continued)
116
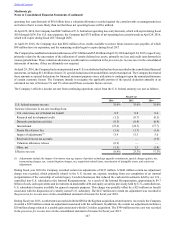
(in millions) Total Level 3
Investments Insurance
Contracts Partnership
Units
Balance as of April 25, 2014 $ 21 $ 11 $ 10
Total unrealized gains included in accumulated other comprehensive (loss)
income 1 (1) 2
Purchases and sales, net 63 56 7
Currency exchange rate changes (9)(6)(3)
Balance as of April 24, 2015 $ 76 $ 60 $ 16
Retirement Benefit Plan Funding It is the Company’s policy to fund retirement costs within the limits of allowable tax deductions.
During fiscal year 2016, the Company made discretionary contributions of approximately $112 million to the U.S. pension plan.
Internationally, the Company contributed approximately $93 million for pension benefits during fiscal year 2016. The Company
anticipates that it will make contributions of $73 million to its pension benefits in fiscal 2017. Based on the guidelines under the
U.S. Employee Retirement Income Security Act of 1974 and the various guidelines which govern the plans outside the U.S., the
majority of anticipated fiscal year 2015 contributions will be discretionary. The Company believes that, along with pension assets,
the returns on invested pension assets, and Company contributions, the Company will be able to meet its pension and other post-
retirement obligations in the future.
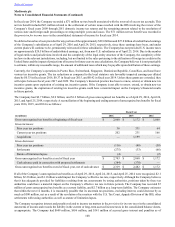
Retiree benefit payments, which reflect expected future service, are anticipated to be paid as follows:
(in millions) U.S. Pension
Benefits Non-U.S. Pension
Benefits
Fiscal Year Gross Payments Gross Payments
2017 $ 87 $ 39
2018 96 40
2019 105 39
2020 116 40
2021 126 43
2022 – 2026 810 265
Total $ 1,340 $ 466
Post-retirement Benefit Plans The net periodic benefit cost associated with the Company’s post-retirement benefit plans was
$12 million, $14 million, and $15 million in fiscal years 2016, 2015, and 2014, respectively. The Company’s projected benefit
obligation for all post-retirement benefit plans was $369 million and $352 million at April 29, 2016 and April 24, 2015, respectively.
The Company’s fair value of plan assets for all post-retirement benefit plans was $269 million and $288 million at April 29, 2016
and April 24, 2015, respectively. The activity during fiscal 2016 and 2015 related to both the change in projected benefit obligations
and the fair value of plan assets was not material.
Defined Contribution Savings Plans The Company has defined contribution savings plans that cover substantially all U.S.
employees and certain non-U.S. employees. The general purpose of these plans is to provide additional financial security during
retirement by providing employees with an incentive to make regular savings. Company contributions to the plans are based on
employee contributions and Company performance and since fiscal year 2006, the entire match has been made in cash. Expense
under these plans was $269 million, $188 million, and $145 million in fiscal years 2016, 2015, and 2014, respectively.
Effective May 1, 2005, the Company froze participation in the original defined benefit pension plan in the U.S. and implemented
two new plans including an additional defined benefit pension plan and a new defined contribution pension plan, respectively: the
Personal Pension Account (PPA) and the Personal Investment Account (PIA). Employees in the U.S. hired on or after May 1, 2005
have the option to participate in either the PPA or the PIA. Participants in the PPA receive an annual allocation of their salary and
bonus on which they will receive an annual guaranteed rate of return which is based on the ten-year Treasury bond rate. Participants
in the PIA also receive an annual allocation of their salary and bonus; however, they are allowed to determine how to invest their
funds among identified fund alternatives. The cost associated with the PPA is included in U.S. Pension Benefits in the tables
presented earlier. The defined contribution cost associated with the PIA was approximately $58 million, $53 million, and $50
million in fiscal years 2016, 2015, and 2014, respectively.