Mercedes 2015 Annual Report Download - page 231
Download and view the complete annual report
Please find page 231 of the 2015 Mercedes annual report below. You can navigate through the pages in the report by either clicking on the pages listed below, or by using the keyword search tool below to find specific information within the annual report.-
 1
1 -
2
-
3
-
4
-
5
-
6
-
7
-
8
-
9
-
10
-
11
-
12
-
13
-
14
-
15
-
16
-
17
-
18
-
19
-
20
-
21
-
22
-
23
-
24
-
25
-
26
-
27
-
28
-
29
-
30
-
31
-
32
-
33
-
34
-
35
-
36
-
37
-
38
-
39
-
40
-
41
-
42
-
43
-
44
-
45
-
46
-
47
-
48
-
49
-
50
-
51
-
52
-
53
-
54
-
55
-
56
-
57
-
58
-
59
-
60
-
61
-
62
-
63
-
64
-
65
-
66
-
67
-
68
-
69
-
70
-
71
-
72
-
73
-
74
-
75
-
76
-
77
-
78
-
79
-
80
-
81
-
82
-
83
-
84
-
85
-
86
-
87
-
88
-
89
-
90
-
91
-
92
-
93
-
94
-
95
-
96
-
97
-
98
-
99
-
100
-
101
-
102
-
103
-
104
-
105
-
106
-
107
-
108
-
109
-
110
-
111
-
112
-
113
-
114
-
115
-
116
-
117
-
118
-
119
-
120
-
121
-
122
-
123
-
124
-
125
-
126
-
127
-
128
-
129
-
130
-
131
-
132
-
133
-
134
-
135
-
136
-
137
-
138
-
139
-
140
-
141
-
142
-
143
-
144
-
145
-
146
-
147
-
148
-
149
-
150
-
151
-
152
-
153
-
154
-
155
-
156
-
157
-
158
-
159
-
160
-
161
-
162
-
163
-
164
-
165
-
166
-
167
-
168
-
169
-
170
-
171
-
172
-
173
-
174
-
175
-
176
-
177
-
178
-
179
-
180
-
181
-
182
-
183
-
184
-
185
-
186
-
187
-
188
-
189
-
190
-
191
-
192
-
193
-
194
-
195
-
196
-
197
-
198
-
199
-
200
-
201
-
202
-
203
-
204
-
205
-
206
-
207
-
208
-
209
-
210
-
211
-
212
-
213
-
214
-
215
-
216
-
217
-
218
-
219
-
220
-
 221
221 -
 222
222 -
 223
223 -
 224
224 -
 225
225 -
 226
226 -
 227
227 -
 228
228 -
 229
229 -
 230
230 -
 231
231 -
 232
232 -
 233
233 -
 234
234 -
 235
235 -
 236
236 -
 237
237 -
 238
238 -
 239
239 -
 240
240 -
 241
241 -
242
-
243
-
244
-
245
-
246
-
247
-
248
-
249
-
250
-
251
-
252
-
253
-
254
-
255
-
256
-
257
-
258
-
259
-
260
-
261
-
262
-
263
-
264
-
265
-
266
-
267
-
268
-
269
-
270
-
271
-
272
-
273
-
274
-
275
-
276
-
277
-
278
-
279
-
280
-
281
-
282
-
283
-
284
-
285
-
286
-
287
 |
 |

238 E | CONSOLIDATED FINANCIAL STATEMENTS | NOTES TO THE CONSOLIDATED FINANCIAL STATEMENTS
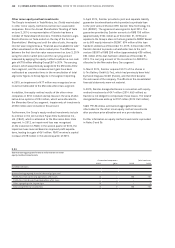
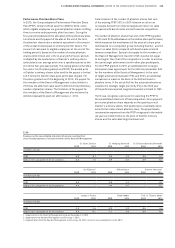
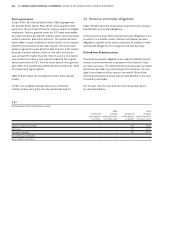
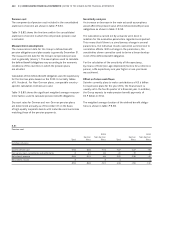
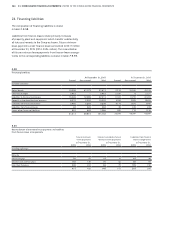
Reconciliation of the net obligation from
defined benefit pension plans
The development of the relevant factors is shown
in table E.49.
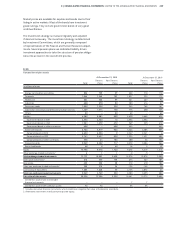
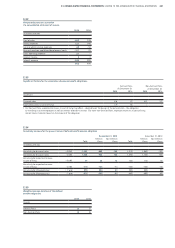
Composition of plan assets
Plan assets and income from plan assets are used solely to pay
pension benefits and to administer the plans. The composition
of the Group’s pension plan assets is shown in table E.50.
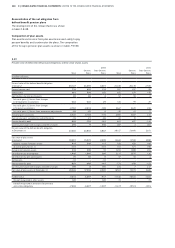
E.49
Present value of defined benefit pension obligations and fair value of plan assets
2015 2014
Total
German
Plans
Non-German
Plans
Total
German
Plans
Non-German
Plans
In millions of euros
Present value of the defined benefit obligation
at January 1
30,127
26,496
3,631
23,230
20,310
2,920
Current service cost 716 602 114 527 437 90
Interest cost 661 509 152 822 679 143
Contributions by plan participants 69 65 4 57 55 2
Actuarial gains (-)/losses from changes
in demographic assumptions
-464
-435
-29
168
99
69
Actuarial gains (-)/losses from changes
in financial assumptions
-2,762
-2,614
-148
5,867
5,629
238
Actuarial gains (-)/losses from experience adjustments -94 -99 5 -32 -41 9
Actuarial gains (-)/losses -3,320 -3,148 -172 6,003 5,687 316
Past service cost, curtailments and settlements -15 21 -36 22 19 3
Pension benefits paid -894 -733 -161 -841 -697 -144
Currency exchange-rate changes and other changes 296 -9 305 307 6 301
Present value of the defined benefit obligation
at December 31
27,640
23,803
3,837
30,127
26,496
3,631
Fair value of plan assets
at January 1
18,581
15,973
2,608
14,668
12,588
2,080
Interest income from plan assets 419 308 111 533 429 104
Actuarial gains/losses (-) -101 – -101 761 571 190
Actual return on plan assets 318 308 10 1,294 1,000 294
Contributions by the employer 1,900 1,640 260 3,111 2,975 136
Contributions by plan participants 70 65 5 57 53 4
Settlements -12 – -12 –––
Pension benefits paid -829 -688 -141 -773 -650 -123
Currency exchange-rate changes and other changes 198 8 190 224 7 217
Fair value of plan assets at December 31 20,226 17,306 2,920 18,581 15,973 2,608
Funded status -7,414 -6,497 -917 -11,546 -10,523 -1,023
thereof recognized in other assets 120 – 120 73 – 73
thereof recognized in provisions for pensions
and similar obligations
-7,534
-6,497
-1,037
-11,619
-10,523
-1,096