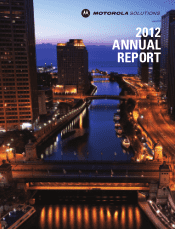
Motorola 2012 Annual Report Download - page 4
Download and view the complete annual report
Please find page 4 of the 2012 Motorola annual report below. You can navigate through the pages in the report by either clicking on the pages listed below, or by using the keyword search tool below to find specific information within the annual report.-
 1
1 -
 2
2 -
 3
3 -
 4
4 -
 5
5 -
 6
6 -
 7
7 -
 8
8 -
 9
9 -
 10
10 -
 11
11 -
 12
12 -
 13
13 -
 14
14 -
 15
15 -
16
-
17
-
18
-
19
-
20
-
21
-
22
-
23
-
24
-
25
-
26
-
27
-
28
-
29
-
30
-
31
-
32
-
33
-
34
-
35
-
36
-
37
-
38
-
39
-
40
-
41
-
42
-
43
-
44
-
45
-
46
-
47
-
48
-
49
-
50
-
51
-
52
-
53
-
54
-
55
-
56
-
57
-
58
-
59
-
60
-
61
-
62
-
63
-
64
-
65
-
66
-
67
-
68
-
69
-
70
-
71
-
72
-
73
-
74
-
75
-
76
-
77
-
78
-
79
-
80
-
81
-
82
-
83
-
84
-
85
-
86
-
87
-
88
-
89
-
90
-
91
-
92
-
93
-
94
-
95
-
96
-
97
-
98
-
99
-
100
-
101
-
102
-
103
-
104
-
105
-
106
-
107
-
108
-
109
-
110
-
111
-
112
-
113
-
114
-
115
-
116
-
117
-
118
-
119
-
120
 |
 |

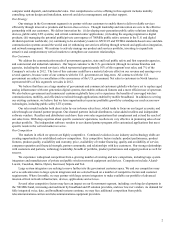
As a shareholder, you can be confident of our focus to drive profitable growth, leverage our distinctive assets
and continue to develop and grow the talent within our ranks on every level.
On behalf of our employees who are committed to fulfilling our purpose to help people be their best in the moments
that matter, we thank you for continued confidence in our company.
Gregory Q. Brown
Chairman and Chief Executive Officer
NON-GAAP EARNINGS
PER SHARE GROWTH*
23%
IN CAPITAL RETURNED
TO SHAREHOLDERS
$2.7B
IN OPERATING CASH FLOW
$1.1B
GROWTH IN GOVERNMENT
BUSINESS
12%
INCREASE IN DIVIDEND
18%
IN ANNUAL R&D SPEND
$1.1B
$1,064
$1,373 $1,503
2010 2011 2012
$803 $848
$1,068
2010 2011 2012
$7,617 $8,203 $8,698
2010 2011 2012
REVENUES OPERATING EARNINGS
OPERATING CASH FLOW EARNINGS PER SHARE FROM
CONTINUING OPERATIONS
(In millions, except per share amounts)
* Excludes highlighted items, stock-based compensation and intangible amortization; see Use of Non-GAAP Information
on inside back cover
$751 $858
$1,256
GAAP
NON-
GAAP*
GAAP
NON-
GAAP*
2010 2011 2012
2012 FINANCIAL HIGHLIGHTS
$0.72
$2.20
$2.95
$1.84
$2.61
$3.20