NVIDIA 2006 Annual Report Download - page 53
Download and view the complete annual report
Please find page 53 of the 2006 NVIDIA annual report below. You can navigate through the pages in the report by either clicking on the pages listed below, or by using the keyword search tool below to find specific information within the annual report.-
 1
1 -
2
-
3
-
4
-
5
-
6
-
7
-
8
-
9
-
10
-
11
-
12
-
13
-
14
-
15
-
16
-
17
-
18
-
19
-
20
-
21
-
22
-
23
-
24
-
25
-
26
-
27
-
28
-
29
-
30
-
31
-
32
-
33
-
34
-
35
-
36
-
37
-
38
-
39
-
40
-
41
-
42
-
 43
43 -
 44
44 -
 45
45 -
 46
46 -
 47
47 -
 48
48 -
 49
49 -
 50
50 -
 51
51 -
 52
52 -
 53
53 -
 54
54 -
 55
55 -
 56
56 -
 57
57 -
 58
58 -
 59
59 -
 60
60 -
 61
61 -
 62
62 -
 63
63 -
64
-
65
-
66
-
67
-
68
-
69
-
70
-
71
-
72
-
73
-
74
-
75
-
76
-
77
-
78
-
79
-
80
-
81
-
82
-
83
-
84
-
85
-
86
-
87
-
88
-
89
-
90
-
91
-
92
-
93
-
94
-
95
-
96
-
97
-
98
-
99
-
100
-
101
-
102
-
103
-
104
-
105
-
106
-
107
-
108
-
109
-
110
-
111
-
112
-
113
-
114
-
115
-
116
-
117
-
118
-
119
-
120
-
121
-
122
-
123
-
124
-
125
-
126
-
127
-
128
-
129
-
130
-
131
-
132
-
133
-
134
-
135
-
136
 |
 |

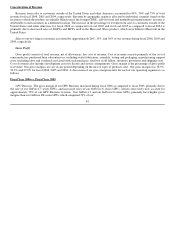
Other Income (Expense), net
Other income and expense primarily consists of realized gains and losses on the sale of marketable securities. Other income
decreased by $1.1 million from fiscal 2005 to fiscal 2006 primarily due to the liquidation of marketable securities during fiscal 2006 in
order to obtain the cash needed for the repatriation of certain foreign earnings under the American Jobs Creation Act of 2004. Other
income decreased by $2.4 million from fiscal 2004 to fiscal 2005 primarily due to $2.5 million of realized gains on the sale of
marketable securities during fiscal 2004 as a result of our liquidation of a significant portion of our marketable securities portfolio in
order to obtain the cash required to redeem the Notes in October 2003. This decrease was offset by a $1.0 million realized gain during
fiscal 2005 related to the receipt of cash and marketable securities as part of an investment exchange.
Income Taxes
We recognized income tax expense of $57.6 million, $25.1 million, and $12.3 million in fiscal 2006, 2005 and 2004, respectively.
Income tax expense as a percentage of income before taxes, or our annual effective tax rate, was 16.0% in fiscal 2006, 20.0% in fiscal
2005, and 14.1% in fiscal 2004.
The difference in the effective tax rates amongst the three years is primarily attributable to changes in our geographic mix of
income subject to tax.
Please refer to Note 13 of the Notes to Consolidated Financial Statements for further information regarding the components of our
income tax expense.
Convertible Debenture Redemption Expense
On October 24, 2003, we fully redeemed the Notes. The aggregate principal amount of the Notes outstanding was $300.0 million,
which included $18.6 million of Notes that we had purchased in the open market during the three months ended October 26, 2003.
The redemption price was equal to approximately 102.7% of the outstanding principal amount of the Notes, plus accrued and unpaid
interest up to, but excluding, the redemption date. In connection with the redemption of the Notes, we recorded a one−time charge in
fiscal 2004 of approximately $13.1 million, which included a $7.6 million redemption premium and $5.5 million of unamortized
issuance costs.
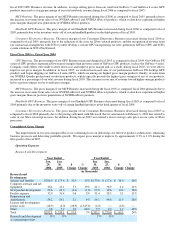
Liquidity and Capital Resources
As of January 29, 2006, we had $950.2 million in cash, cash equivalents and marketable securities, an increase of $280.1 million
from the end of fiscal 2005. As of January 30, 2005, we had $670.0 million in cash, cash equivalents and marketable securities, an
increase of $66.0 million from the end of fiscal 2004. Our portfolio of cash equivalents and marketable securities is managed by
several financial institutions. Our investment policy requires the purchase of top−tier investment grade securities, the diversification of
asset type and certain limits on our portfolio duration.
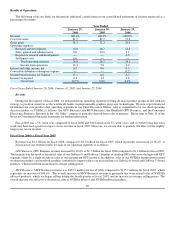
Operating activities generated cash of $446.4 million, $132.2 million, and $49.7 million during fiscal 2006, 2005, and 2004,
respectively. The increase in cash flows from operating activities in fiscal 2006 when compared to fiscal 2005 was primarily related to
the $202.2 million increase in net income and changes in operating assets and liabilities. On our consolidated balance sheet, accrued
liabilities increased $77.2 million primarily due to the recording of income taxes payable for fiscal 2006, the increase in accruals
related to customer programs and the recording of $30.6 million in relation to 3dfx, of which $25.0 million was recorded as an
adjustment to goodwill. Accounts payable decreased $58.8 million and inventories decreased $60.7 million primarily as a result of
significant reductions in older products, offset by an increase in new products. Accounts receivable increased $21.9 million primarily
due to increased sales and improved linearity of sales, and cash collections during the fourth quarter of fiscal 2006 as compared to the
fourth quarter of fiscal 2005. The increase in cash flows from operating activities in fiscal 2005 when compared to fiscal 2004 was
primarily related to the $25.9 million increase in net income and changes in operating assets and liabilities. On our consolidated
balance sheet, accrued liabilities increased $37.3 million
46